Skip to content

Electrical infrastructure monitoring

GridBit EIM adds sensors, analysers and a gateway to a secondary substation and shows the state of the transformer and the low-voltage board in real time. It is a retrofit: the primary equipment stays as it is.

  • Retrofit for existing substations
  • Modbus modules and third-party sensors
  • MQTTS to the cloud
20+
years of work for energy distributors
1.9 M+
smart meters installed in metering projects
20 000+
data concentrators installed
30+
specialists in development

Why now

Three changes meet in the low-voltage grid

01

Intense electrification

Demand for electricity grows by about 4.1 % a year. Heat pumps and charging points overload lines and transformers that were sized for another time.

02

Decentralised and renewable energy

Rooftop plants feed in when the sun shines, not when the load needs it. The intermittent flow unbalances the network.

03

Ageing infrastructure

Old equipment fails more often under a load that changes through the day.

The problem

The low-voltage grid is still in the dark

Generation and transmission were digitised decades ago, and SCADA shows high and medium voltage in real time. Below the secondary substation the operator works blind and often learns about a fault from the customers.

  1. Generation
  2. Transmission
  3. Distribution
  4. Low voltage and customers

65 %

of all grid assets are in the low-voltage network

Without data from the low-voltage side a distributor risks:

  1. 01Expensive but inefficient maintenance
  2. 02More frequent and longer interruptions, worse SAIDI and SAIFI
  3. 03Revenue lost while equipment is down
  4. 04Lower customer satisfaction because service takes longer
  5. 05No basis for planning investments in grid expansion
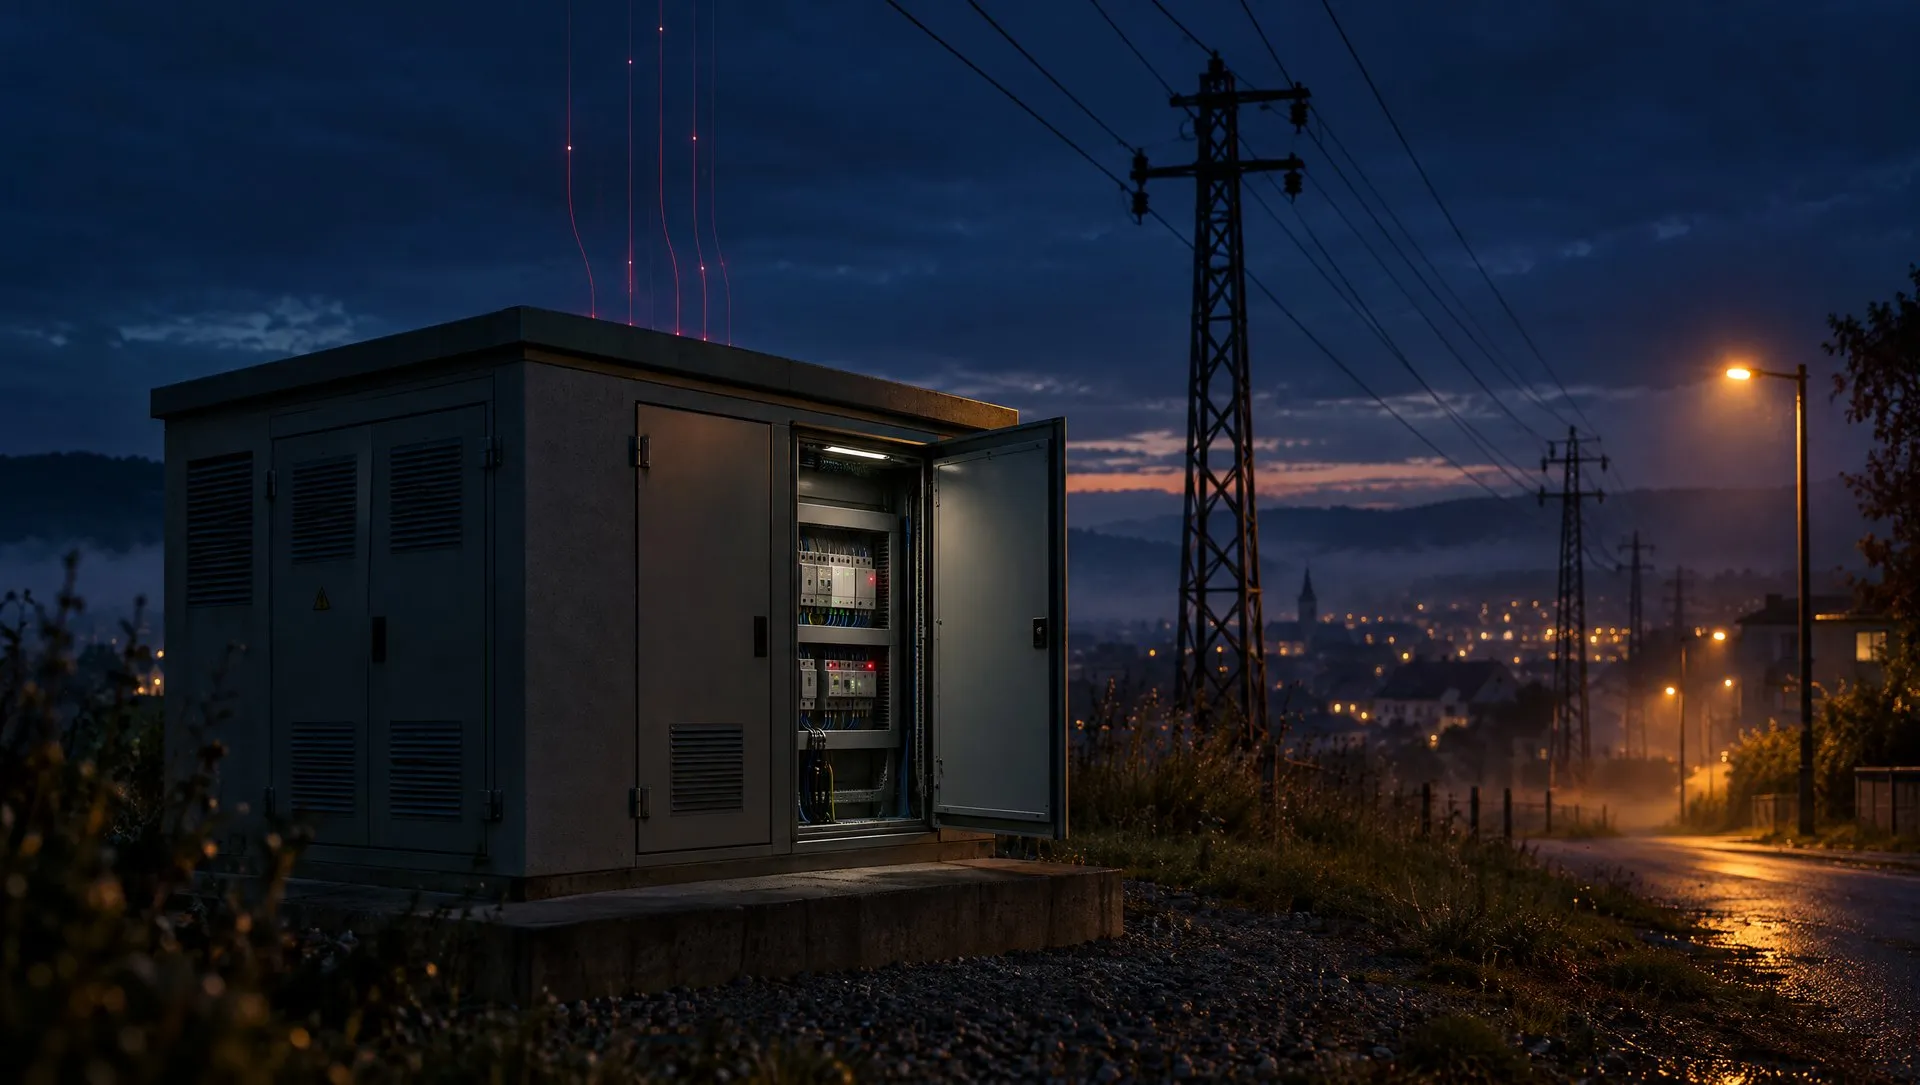
Illustration of a secondary substation

How it works

A substation that reports its own condition

EIM gives the substation digital senses. Compact modules and sensors go in without long outages, and everything talks Modbus to one gateway.

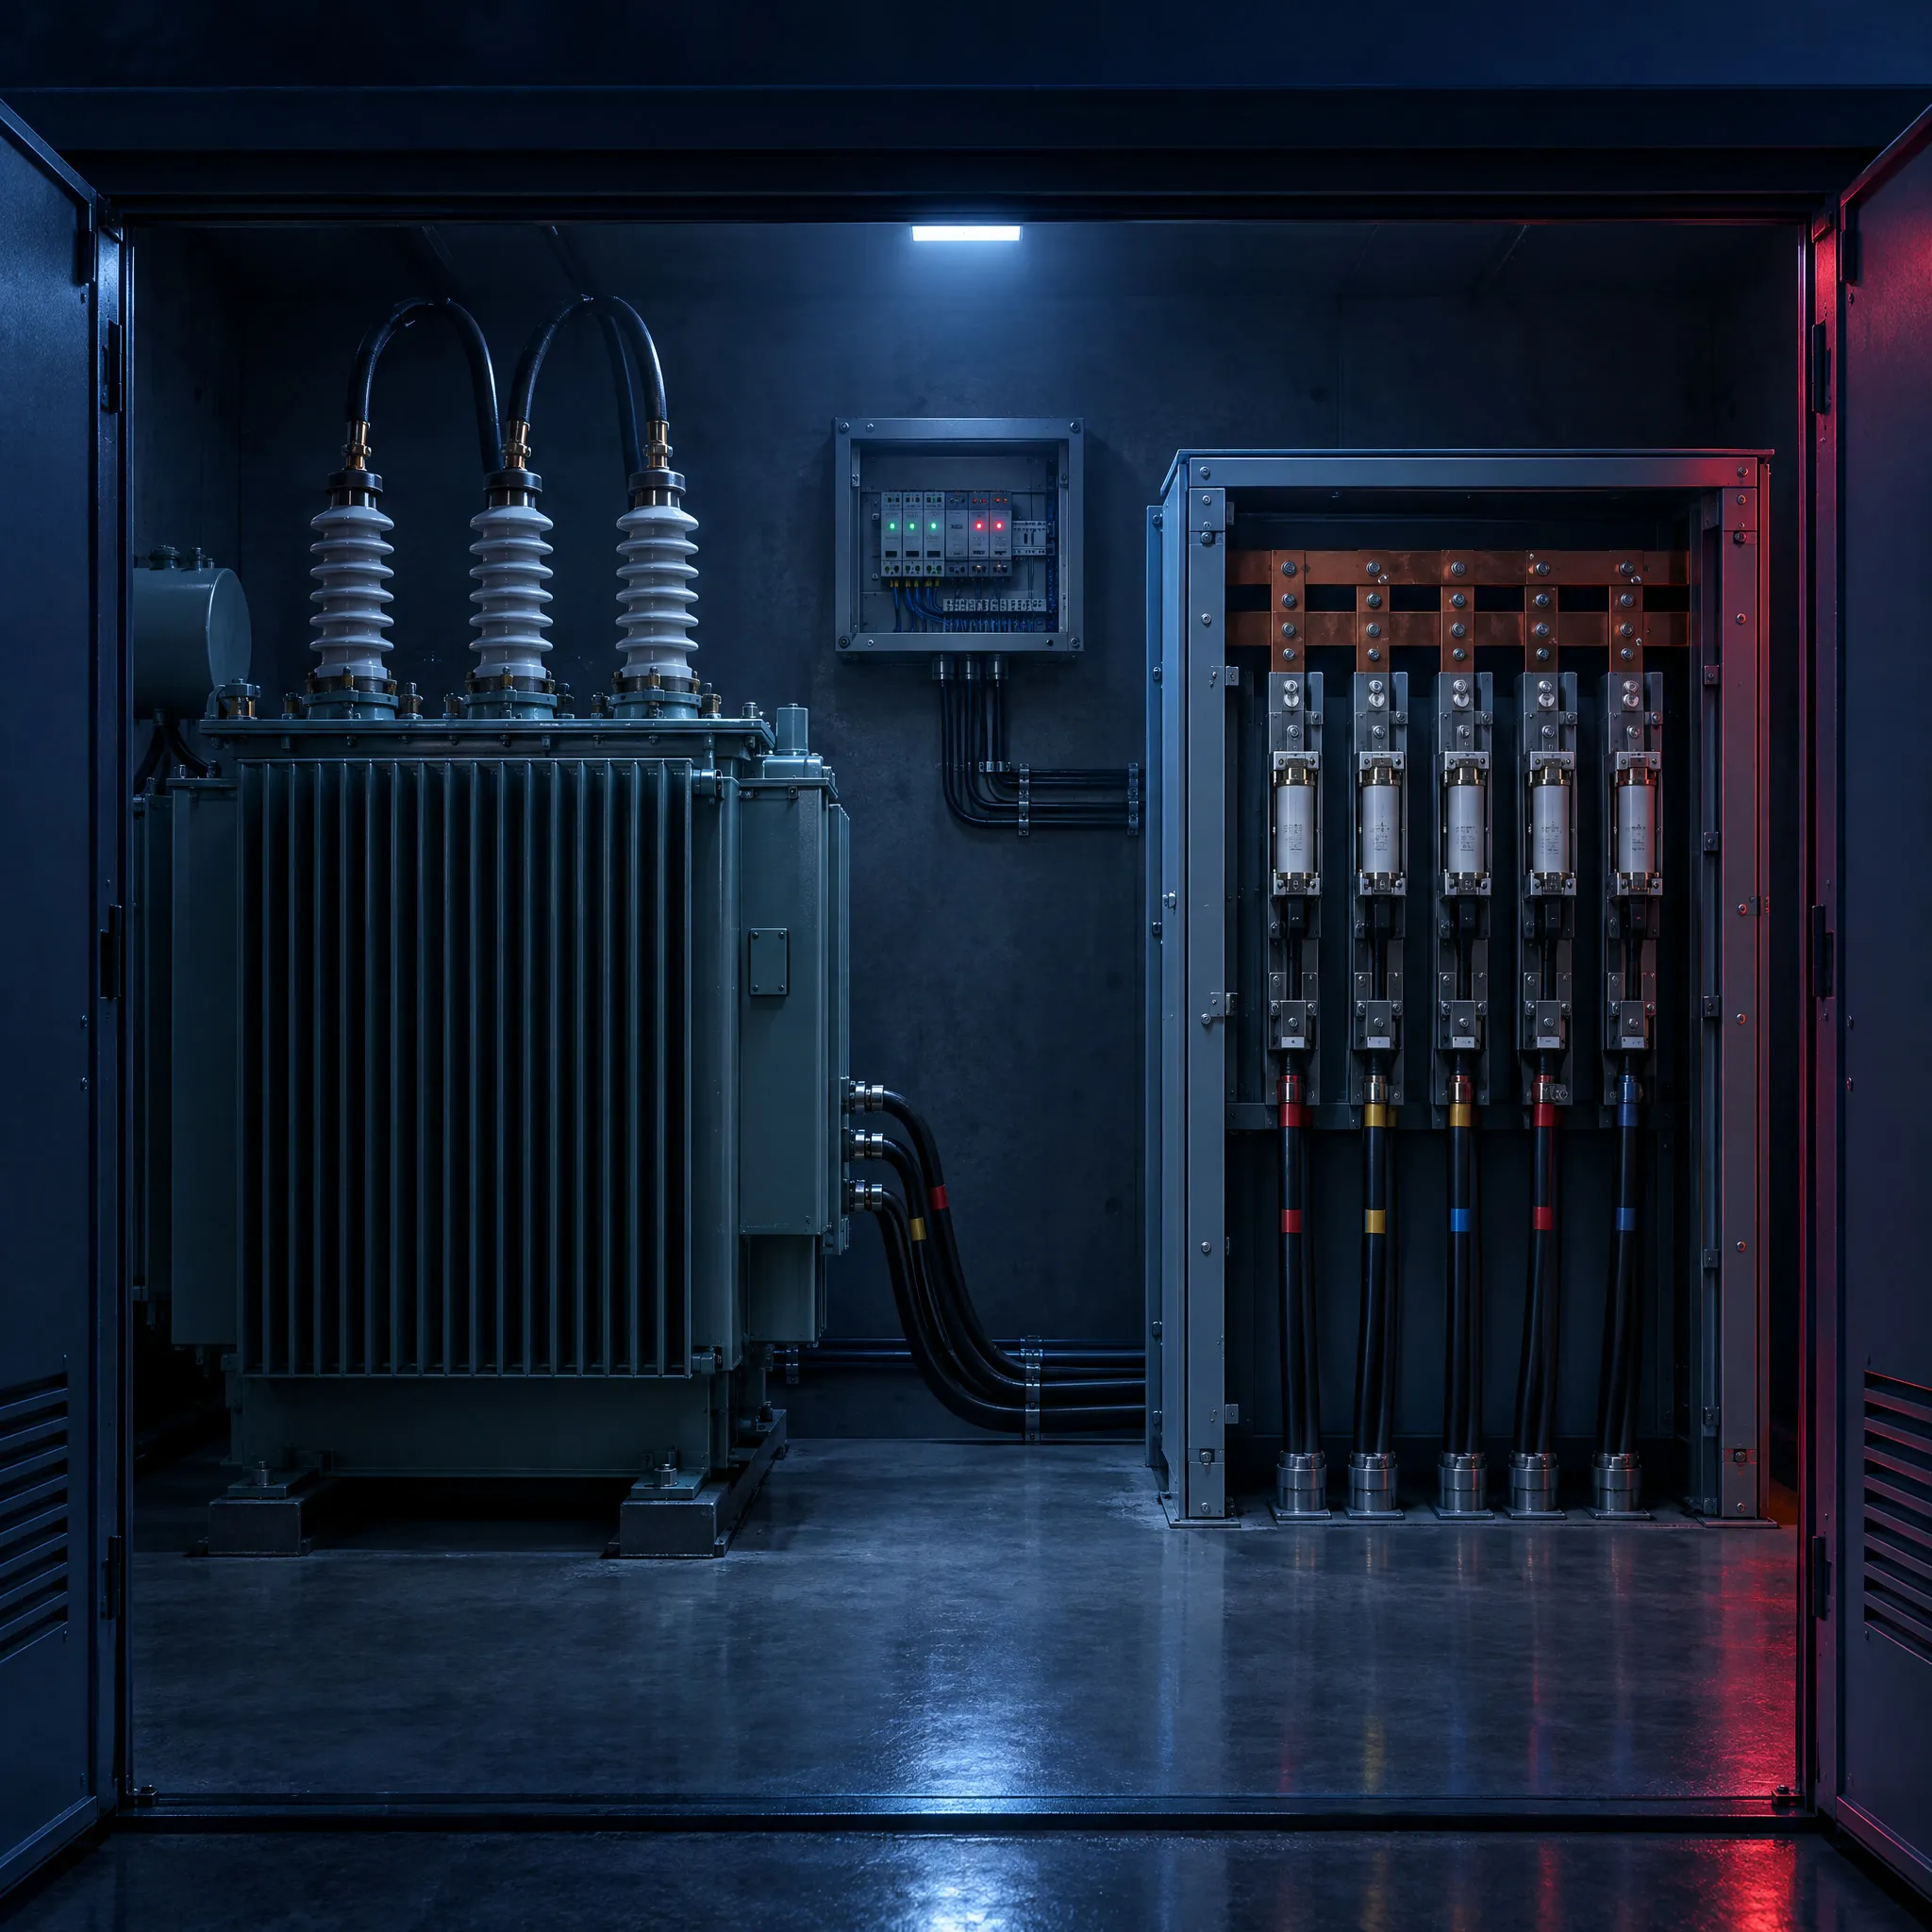
01Transformer

Temperature and condition of the transformer

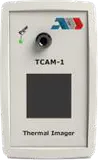
An infrared camera and optical sensors watch the hot spots without touching them. RFID and contact sensors sit where a cable cannot go. The integrated safety detector reports pressure, temperature, oil level and gas.

  • IR camera (TCAM)
  • Optical temperature sensor (TIR)
  • RFID temperature sensor
  • Integrated safety detector monitor
02Switchboard

Every phase and every feeder

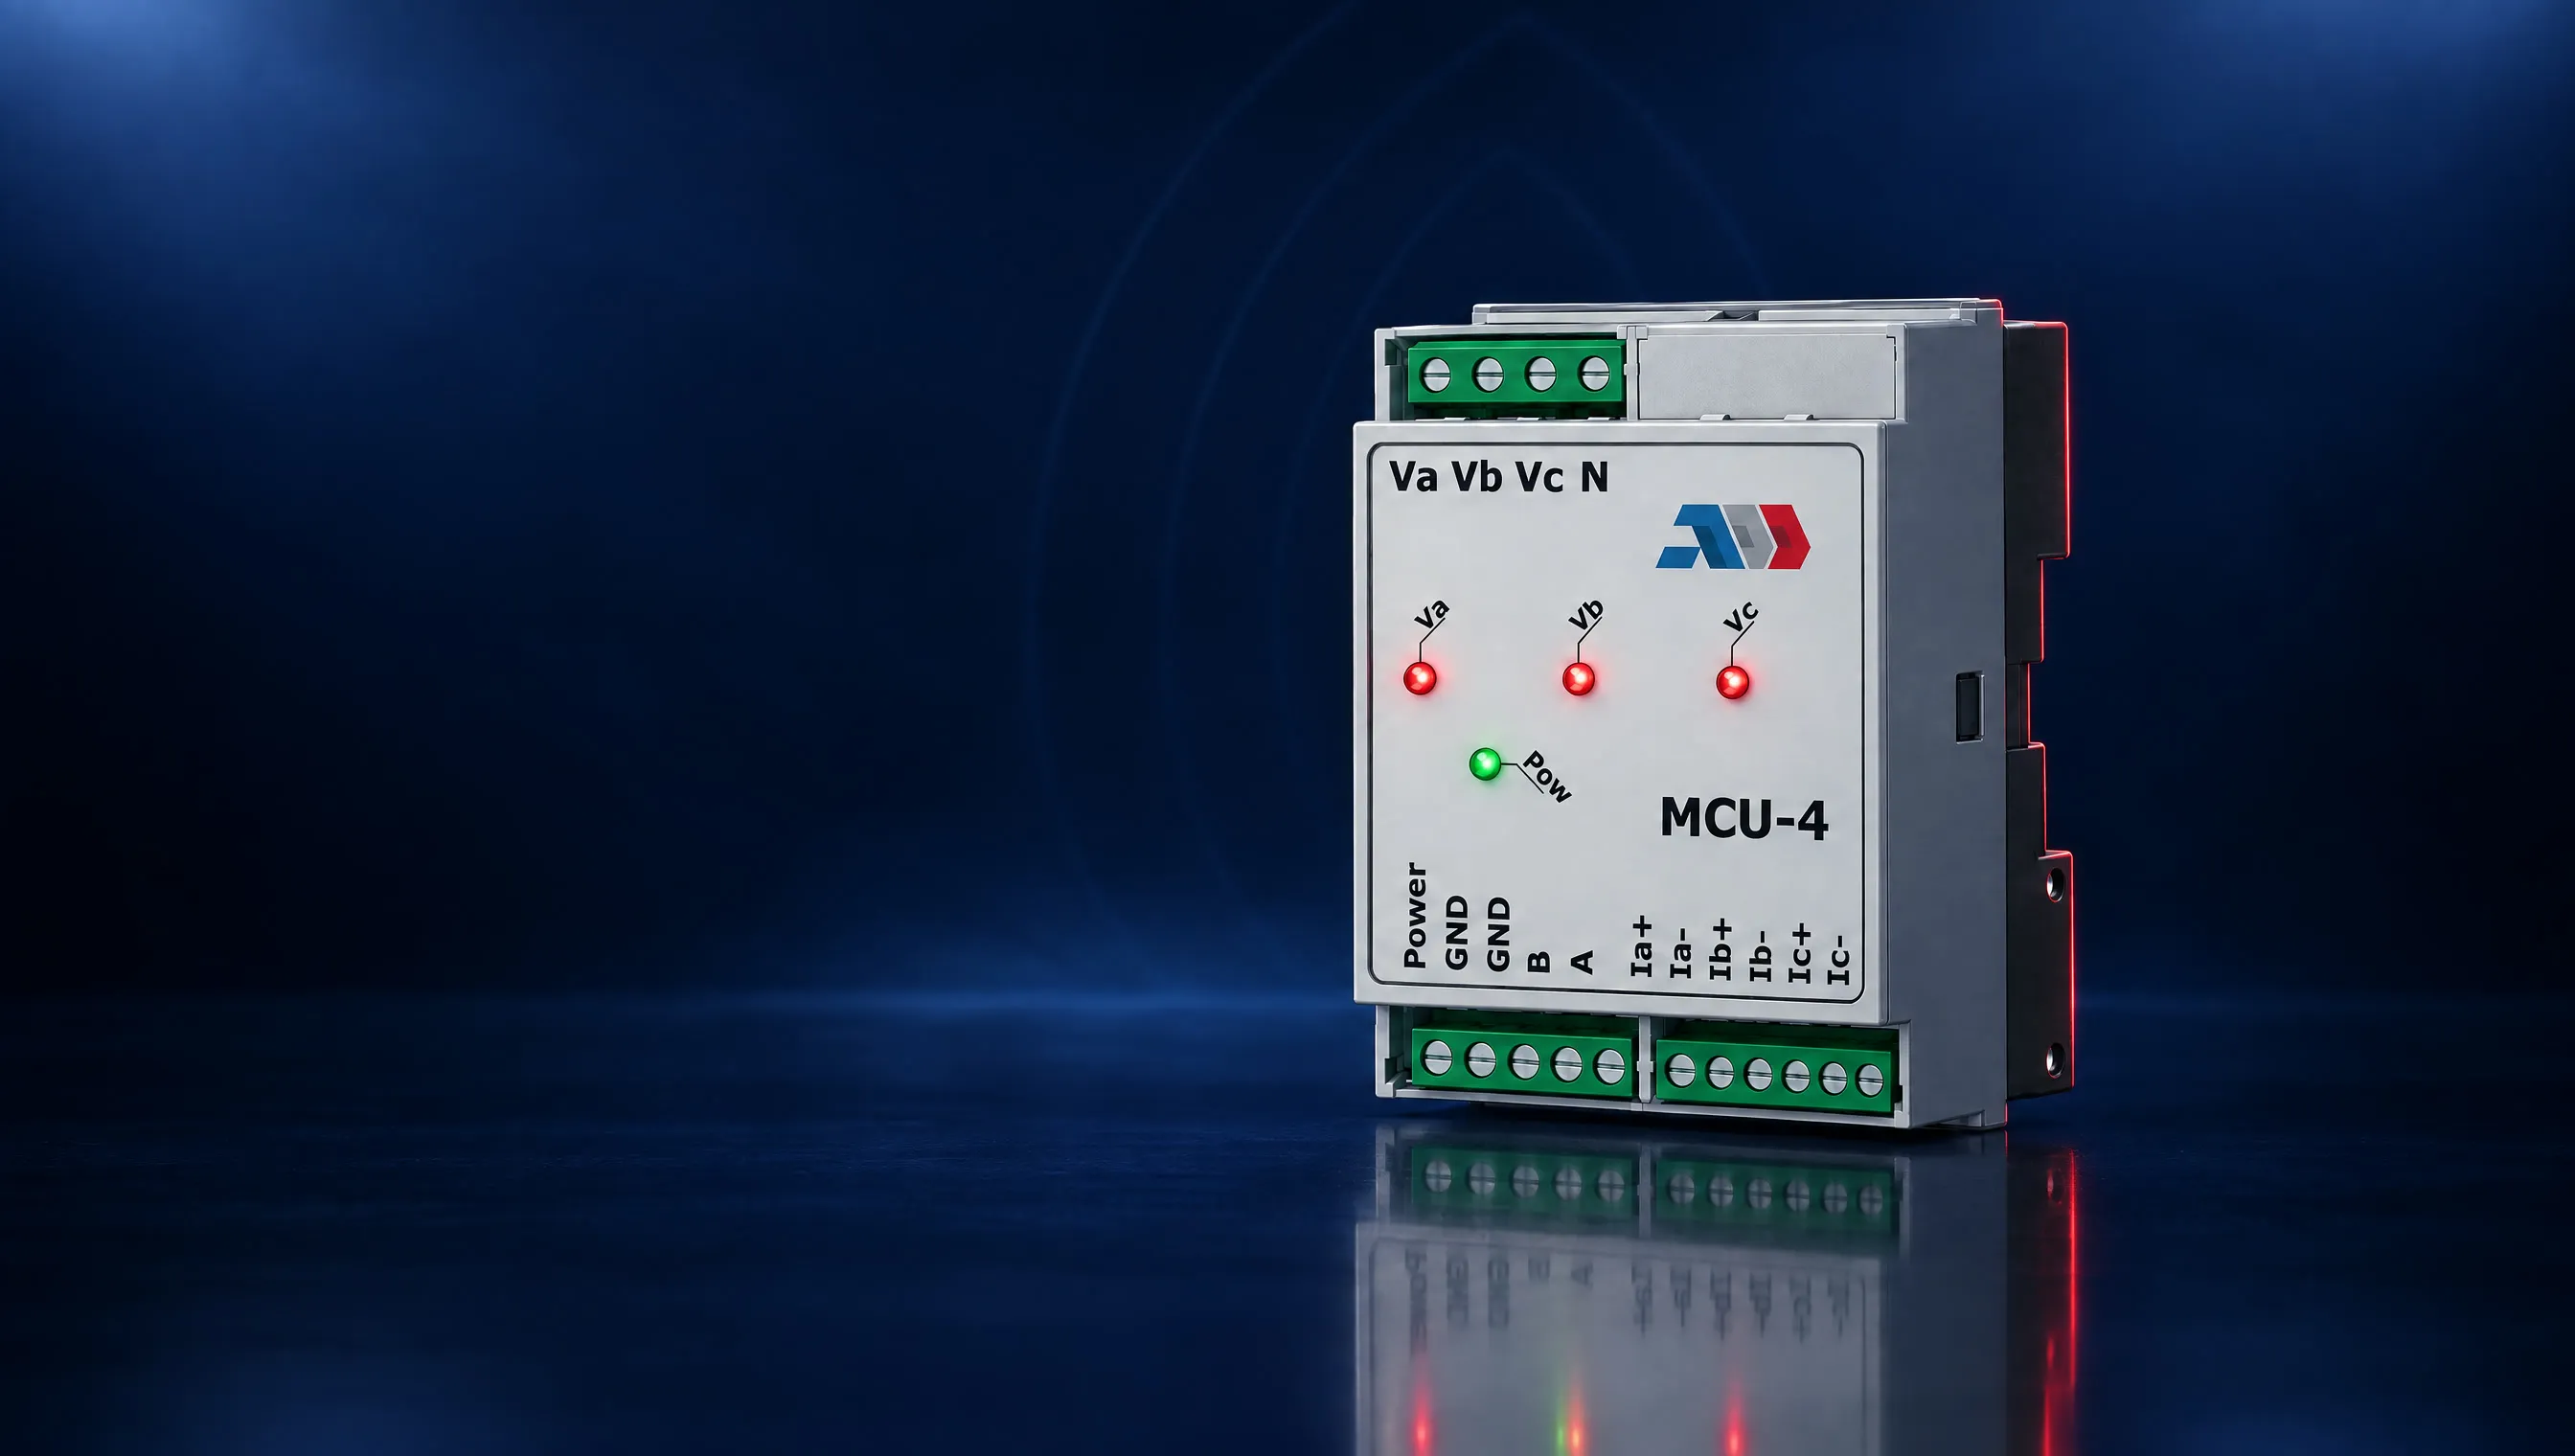
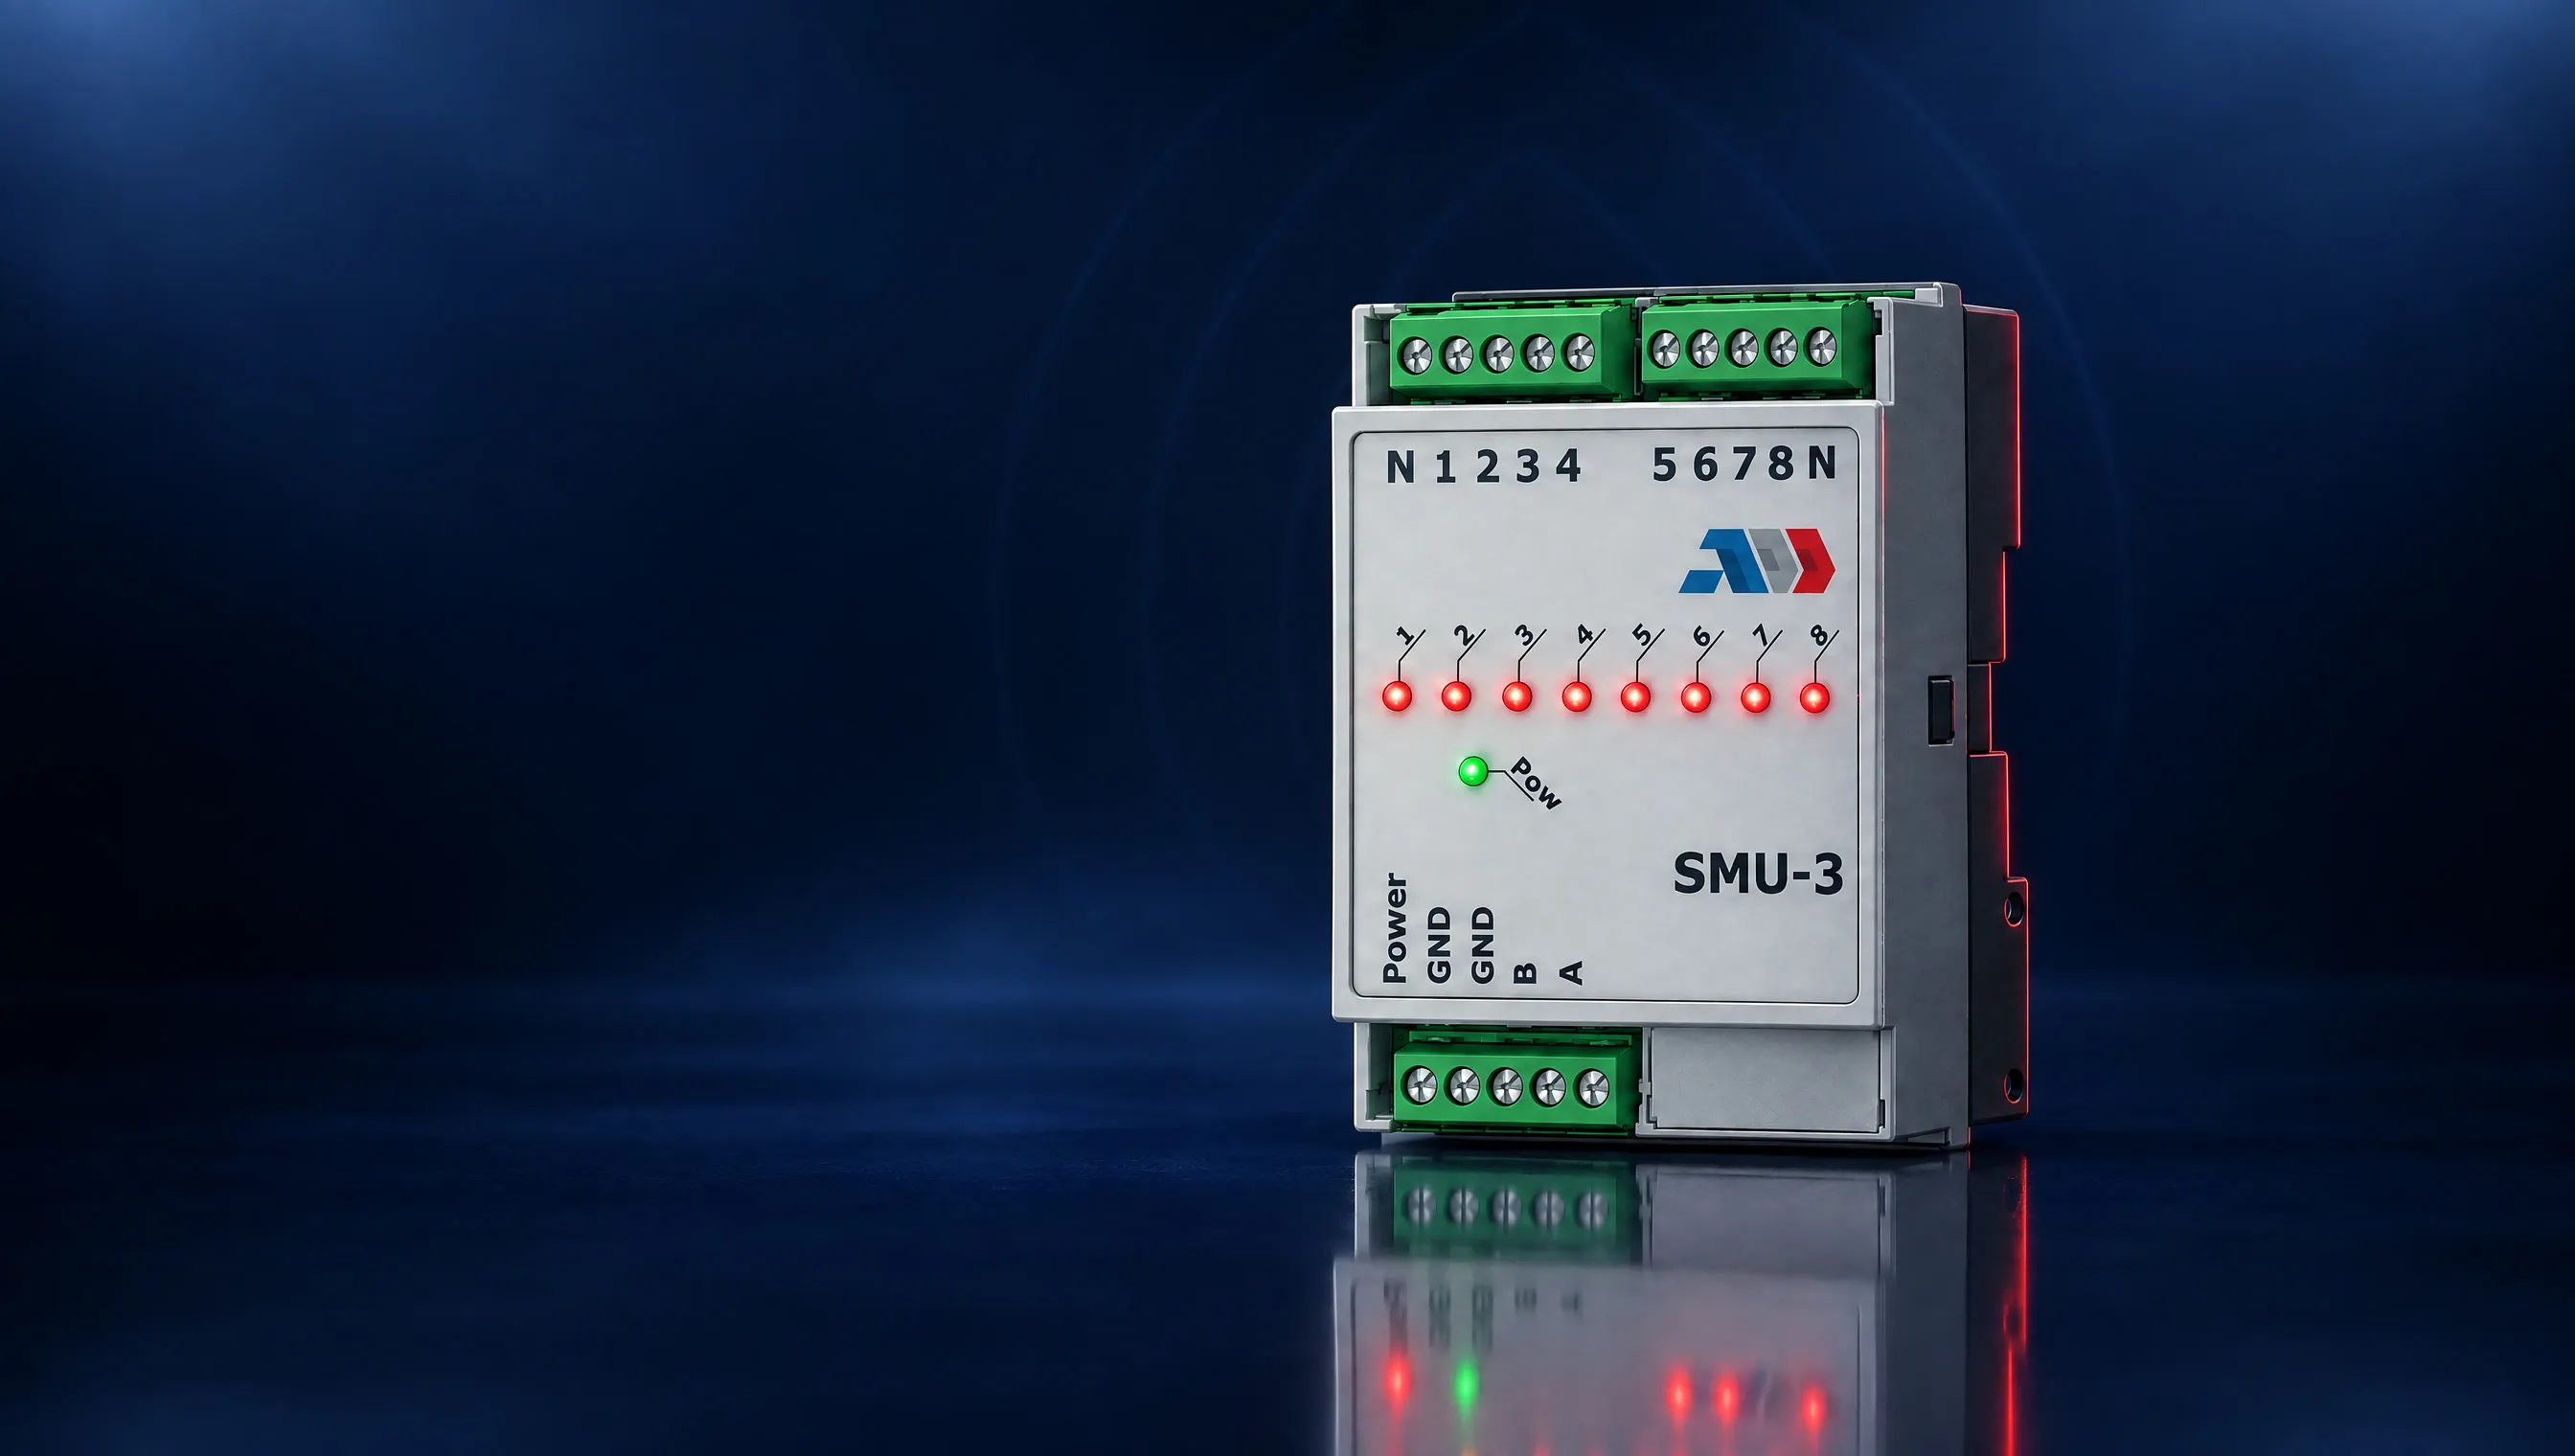
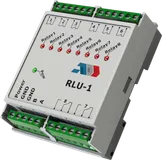
The network analyser measures current, voltage, power and power quality per phase. The voltage detector watches the outgoing feeders, fuses and protections. The relay unit switches lines on a schedule or on command.

  • Power quality monitoring (MCU)
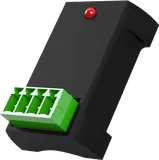
  • Voltage detector (SMU)
  • Relay unit (RLU)
  • Contact temperature sensor (TS2)
  • Optical temperature sensor (TIR)

03Environment

The room itself

Optional third-party sensors on the same Modbus line: humidity and temperature, smoke, water and moisture, intrusion, and any sensor with a 0 to 10 V output.

  • Humidity and temperature
  • Smoke detection
  • Water and moisture
  • Intrusion
  • Other sensors, 0 to 10 V

04Gateway

One gateway for the whole substation

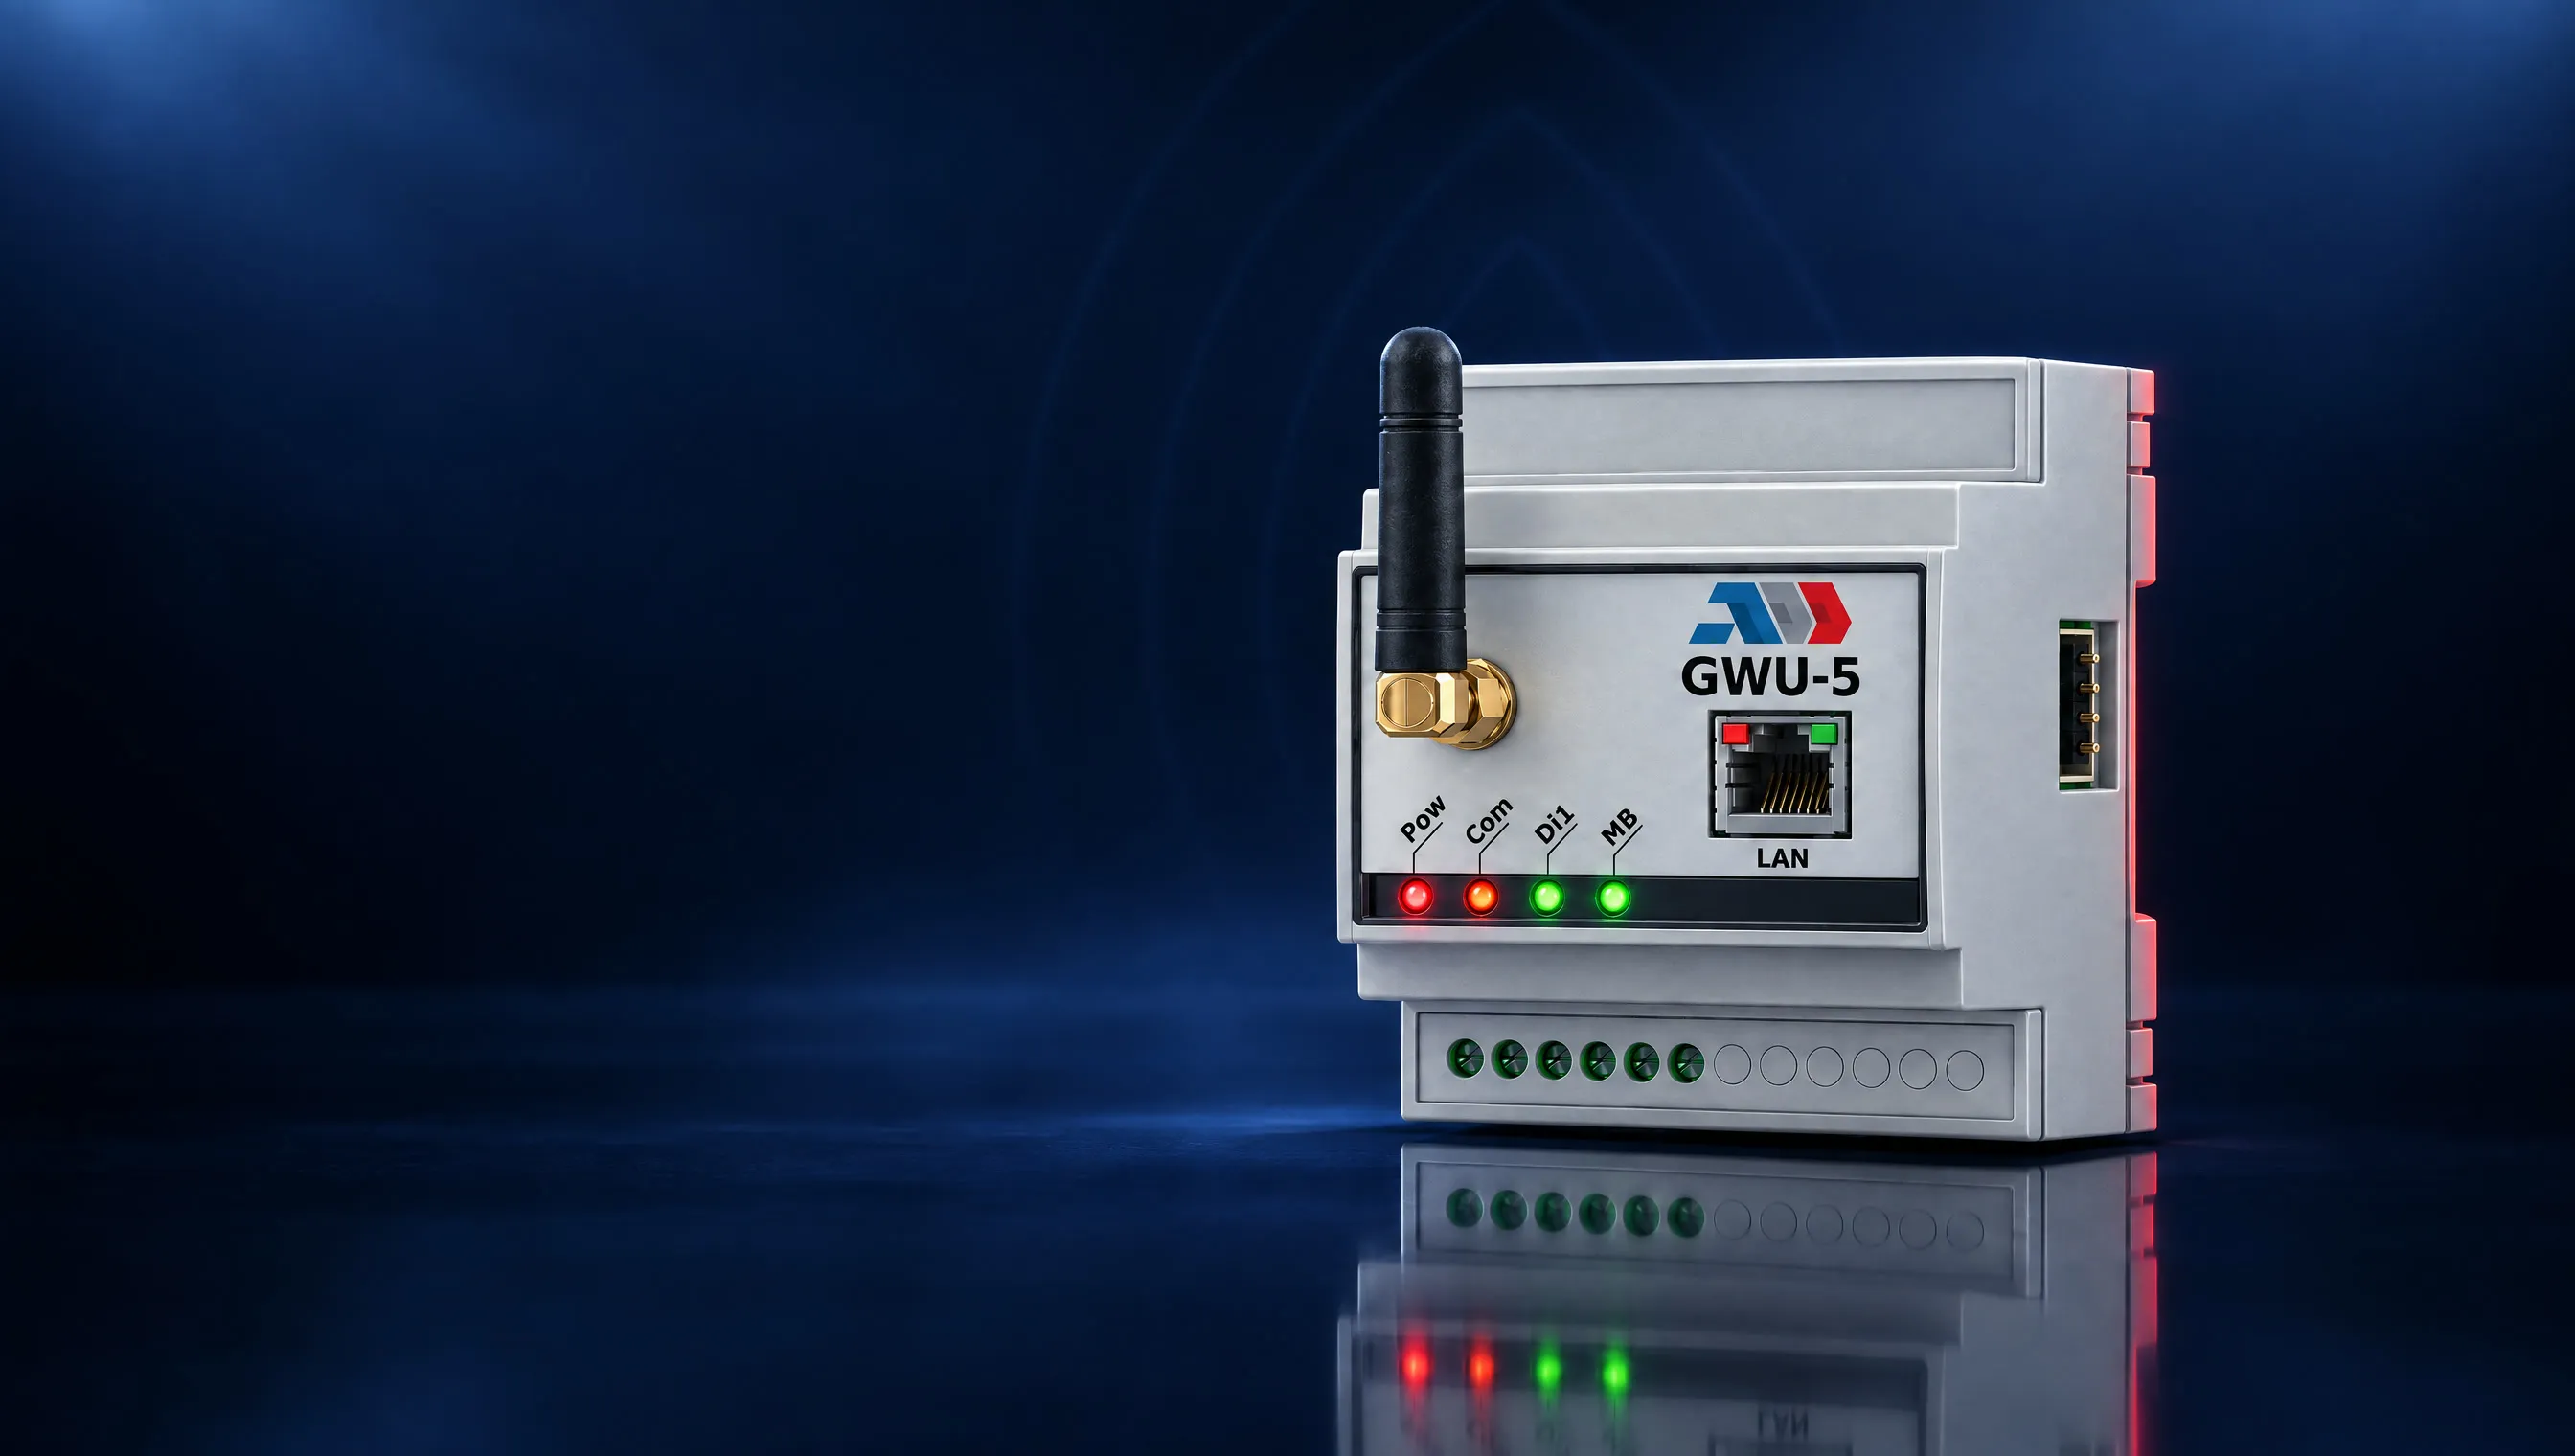
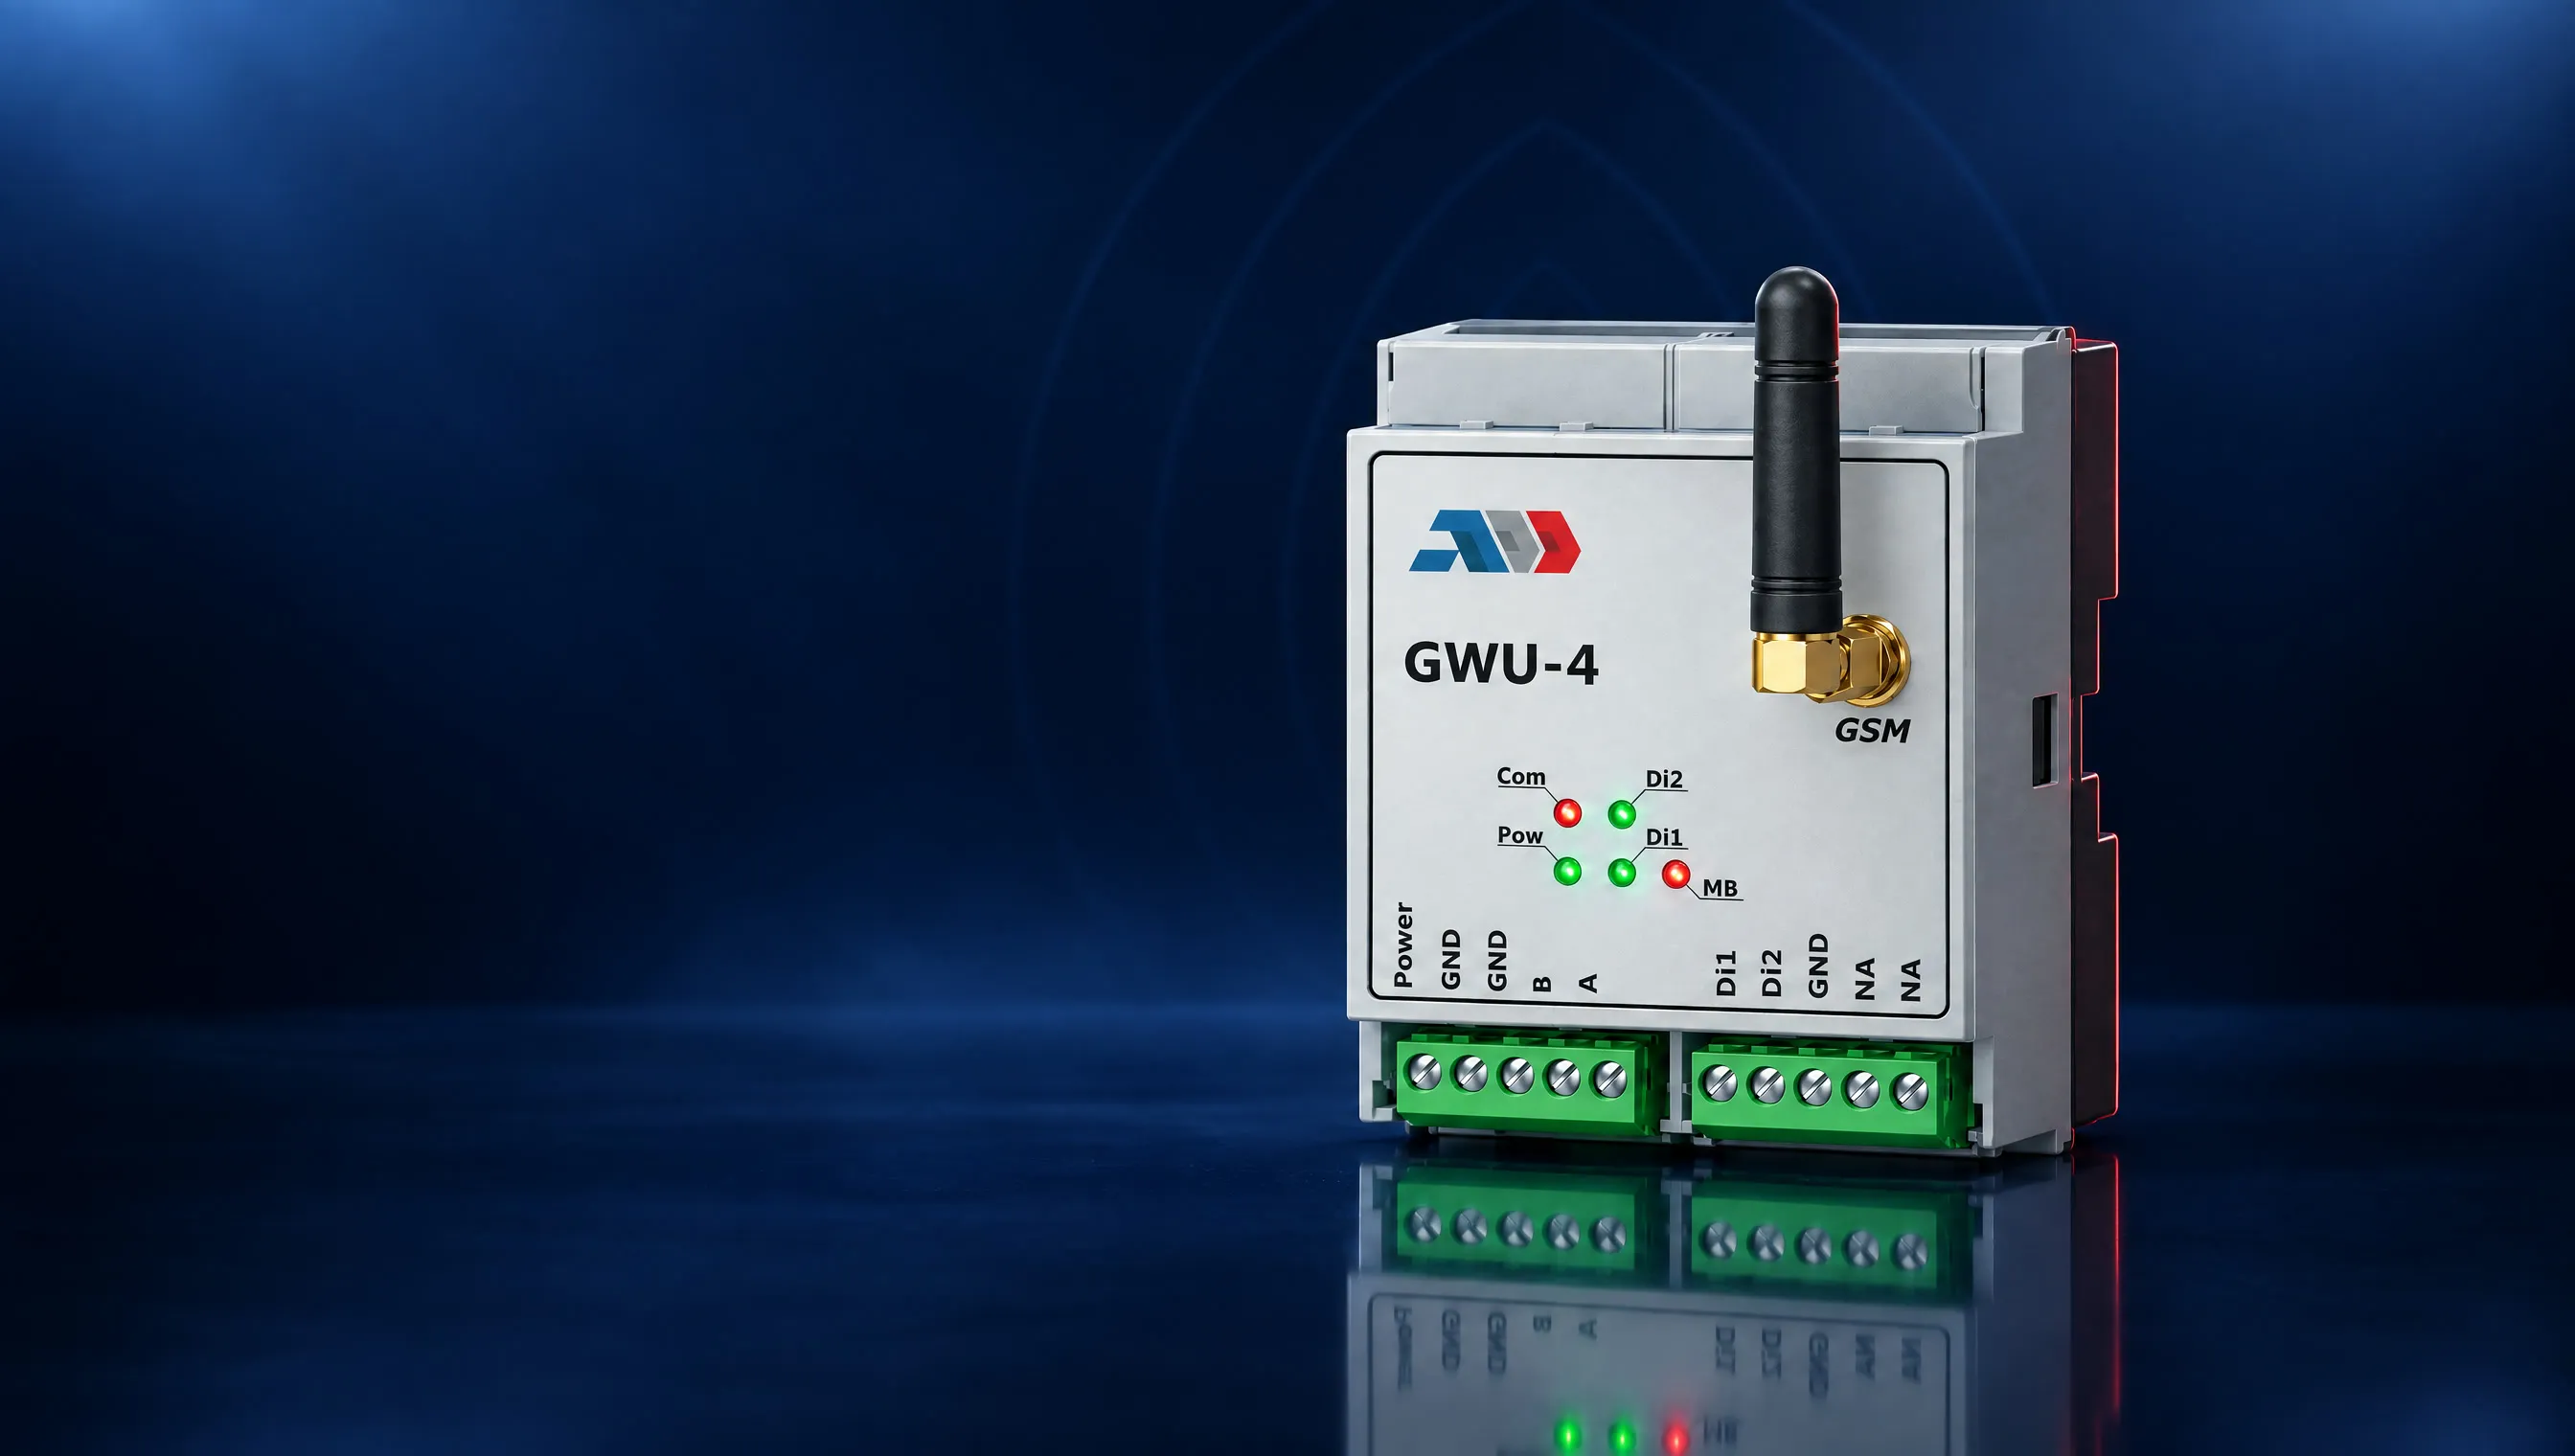
GridBit GWU collects data from the modules and the sensors over Modbus and sends it over the mobile network or Wi-Fi. The link is MQTTS: encrypted and two-way, so commands reach the substation too.

  • Modbus
  • MQTTS
  • GSM or Wi-Fi

05Platform

Software as a service

The platform runs in the cloud on Microsoft Azure. It opens in a browser on any device, with nothing to install, and the data is encrypted.

  • SaaS
  • Microsoft Azure
  • Any device

The platform

One panel per substation

The transformer at a glanceLoad against the limit, hour by hourThe busbar and every circuitPower quality over a weekA substation that needs attentionThe passport of the asset

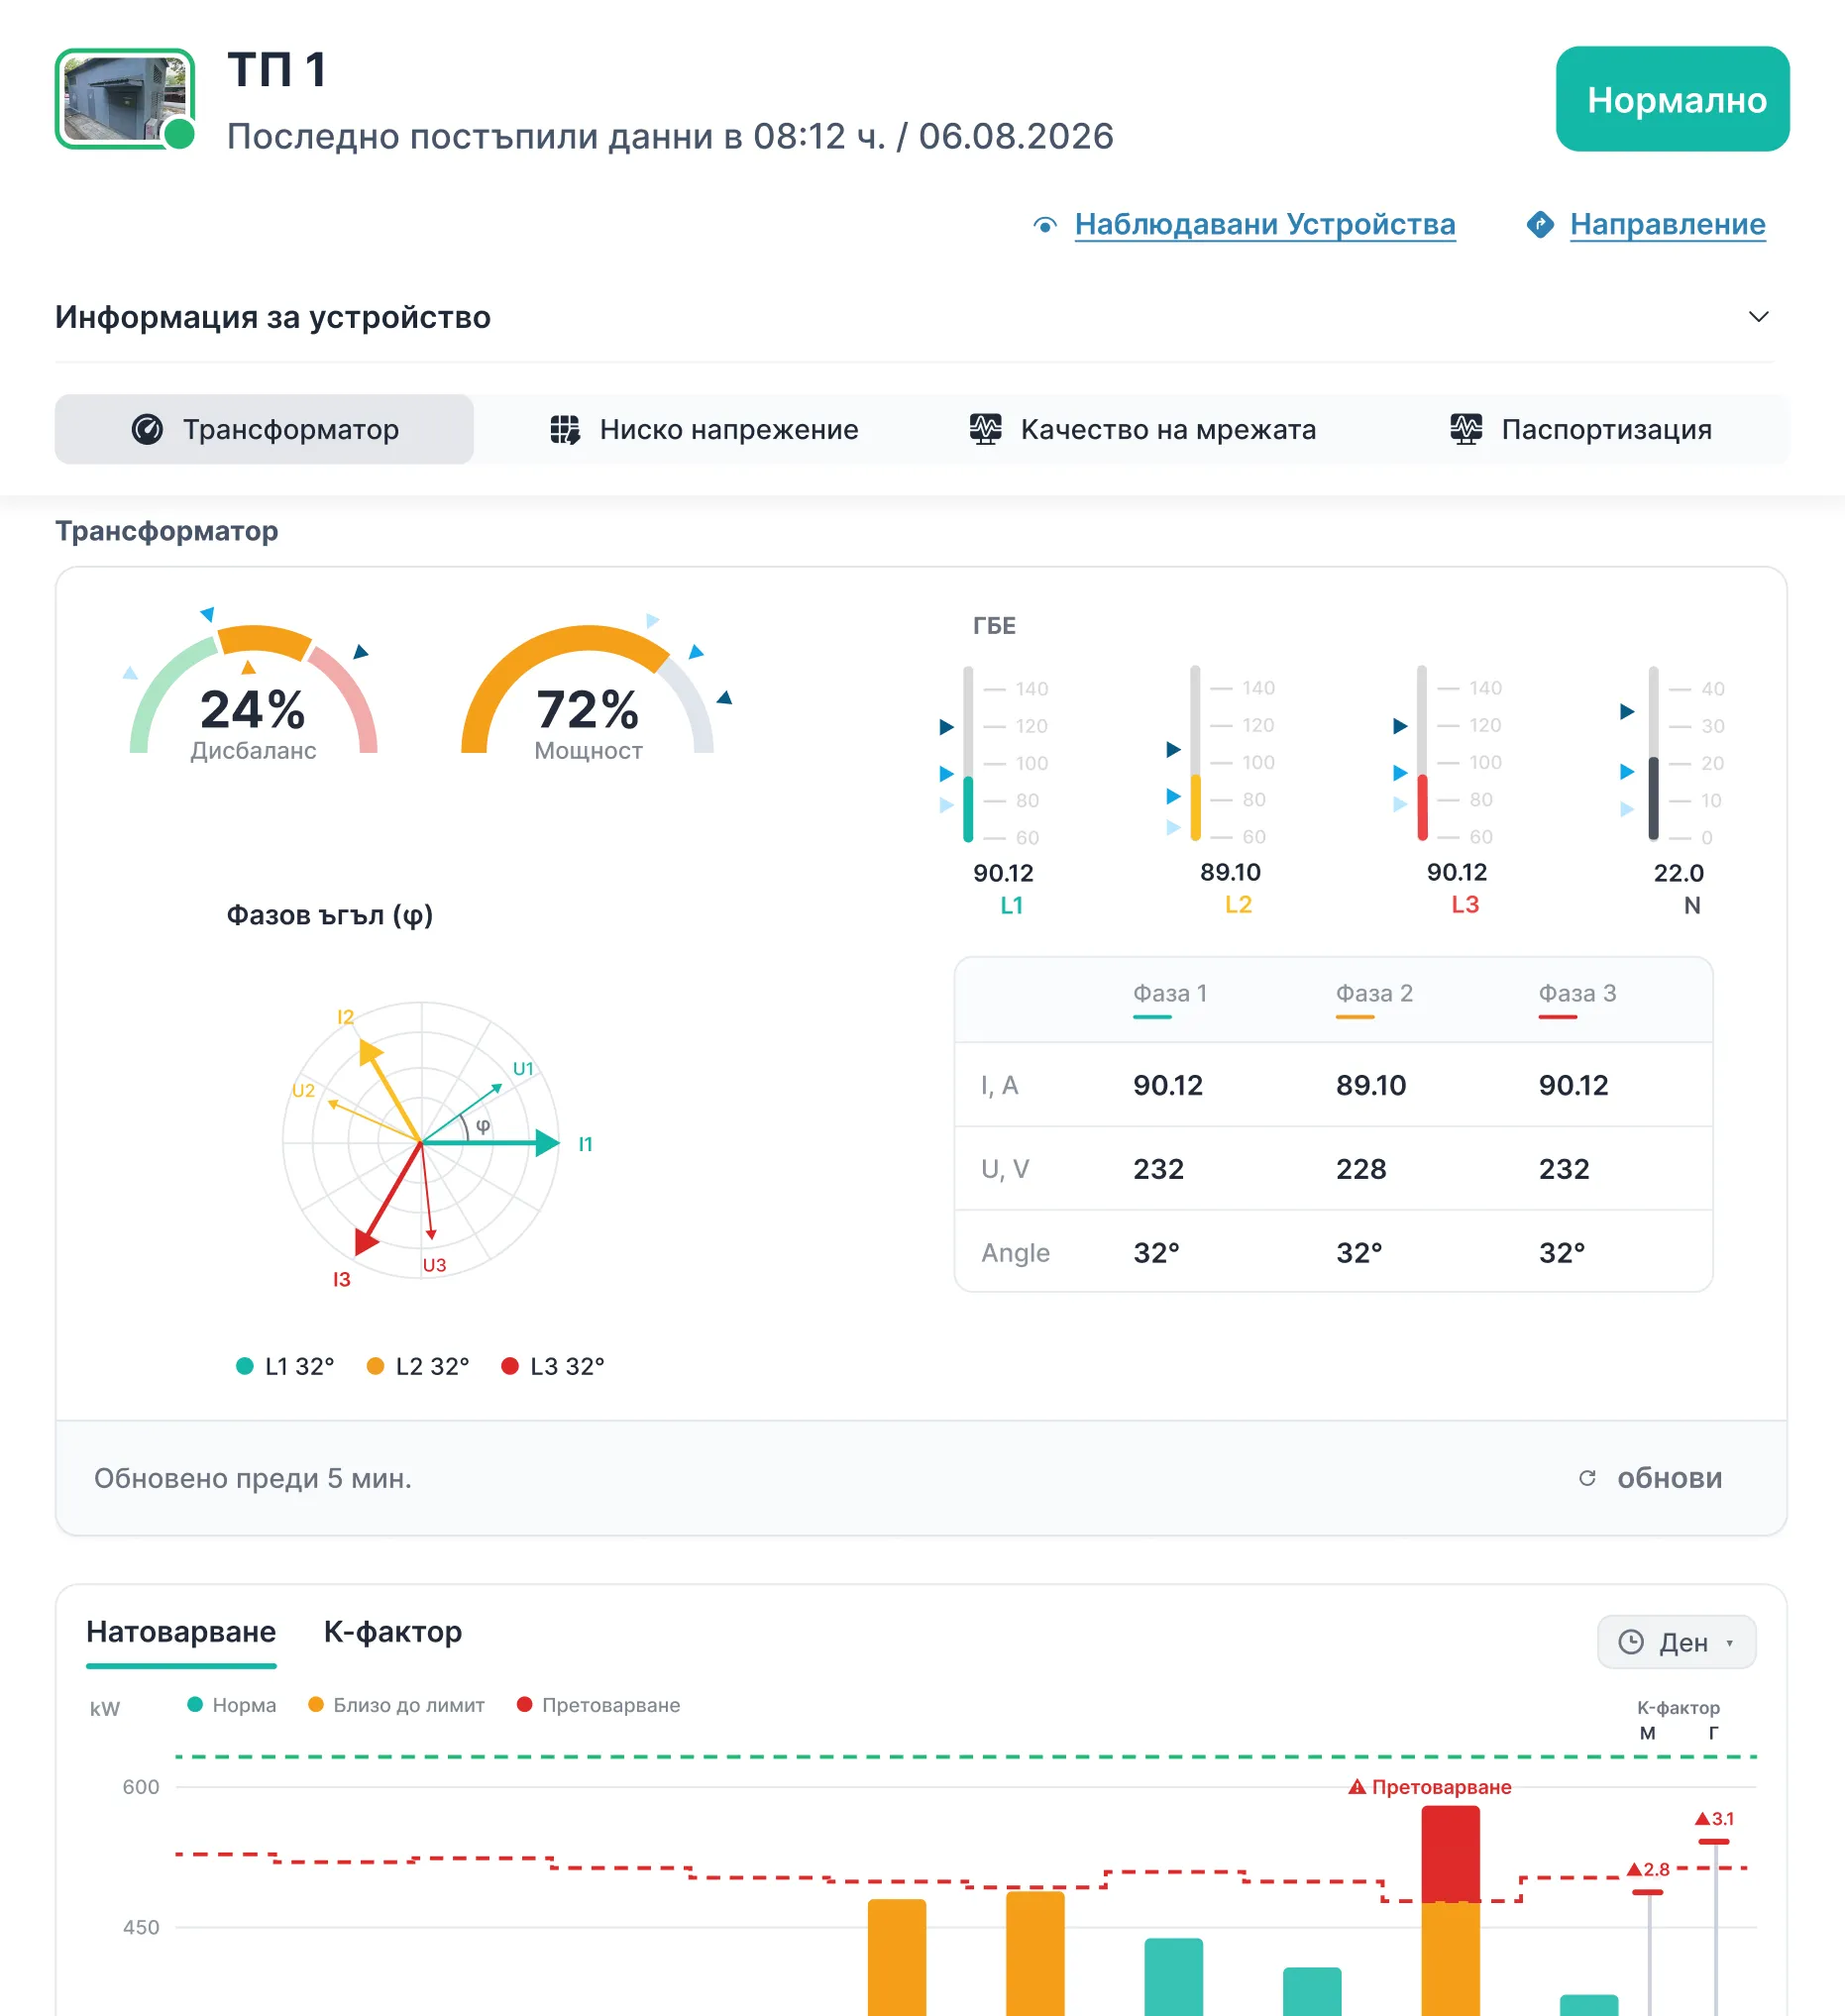
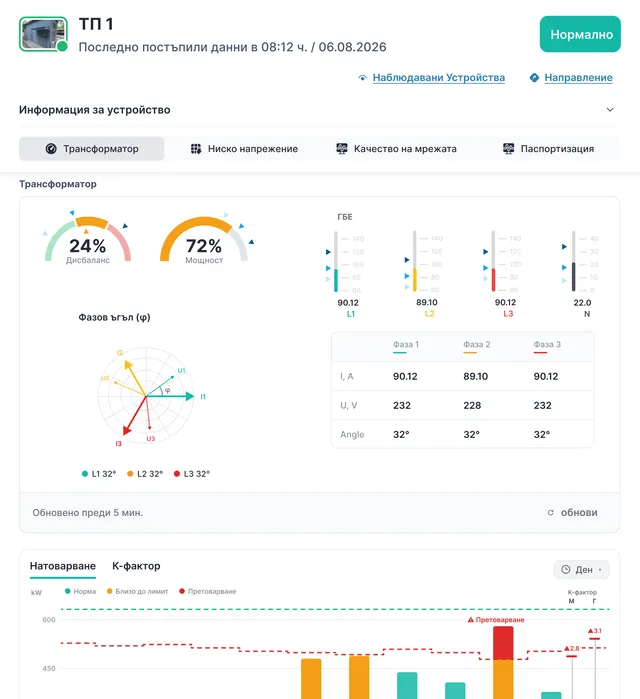
The transformer at a glance

Load and imbalance as gauges, current per phase and in the neutral against its limits, the phase angles as a vector diagram and a table of current, voltage and angle per phase.

Load against the limit, hour by hour

The chart marks the hours near the limit and the hours above it. A second tab shows the K-factor, the extra heating that harmonics cause.

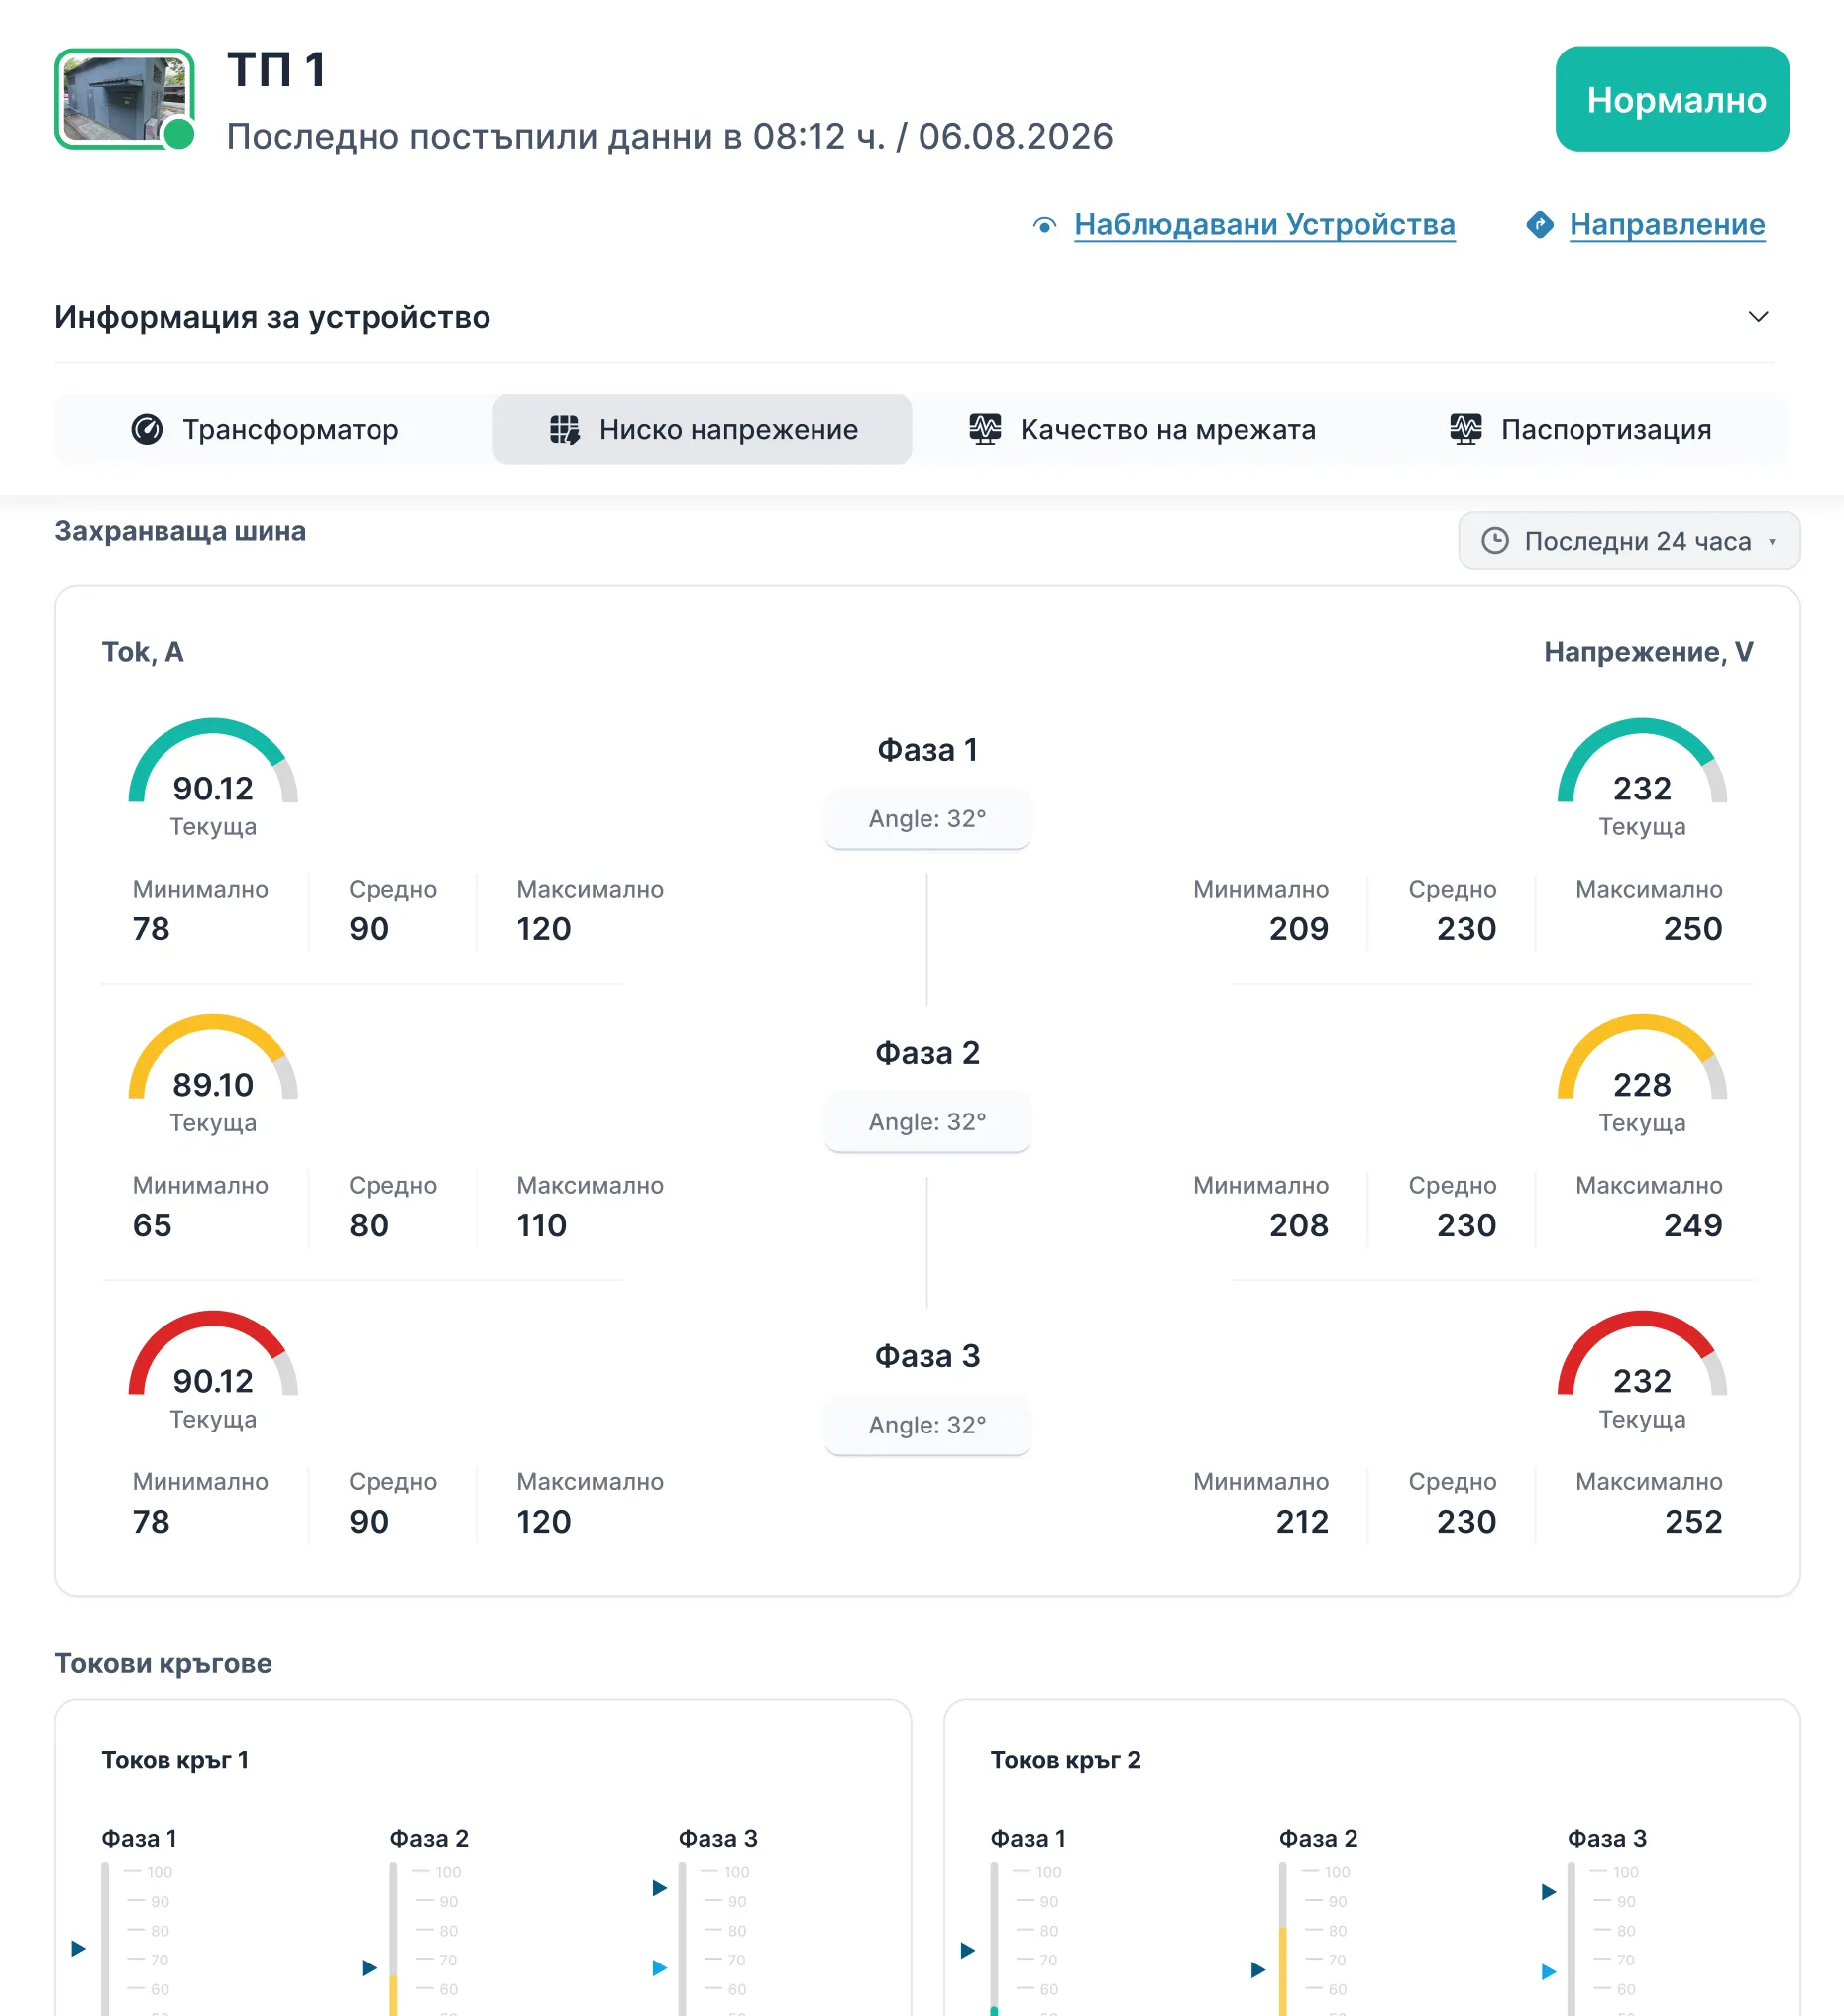
The busbar and every circuit

Current and voltage per phase with the minimum, average and maximum for the period, then the same for each outgoing circuit.

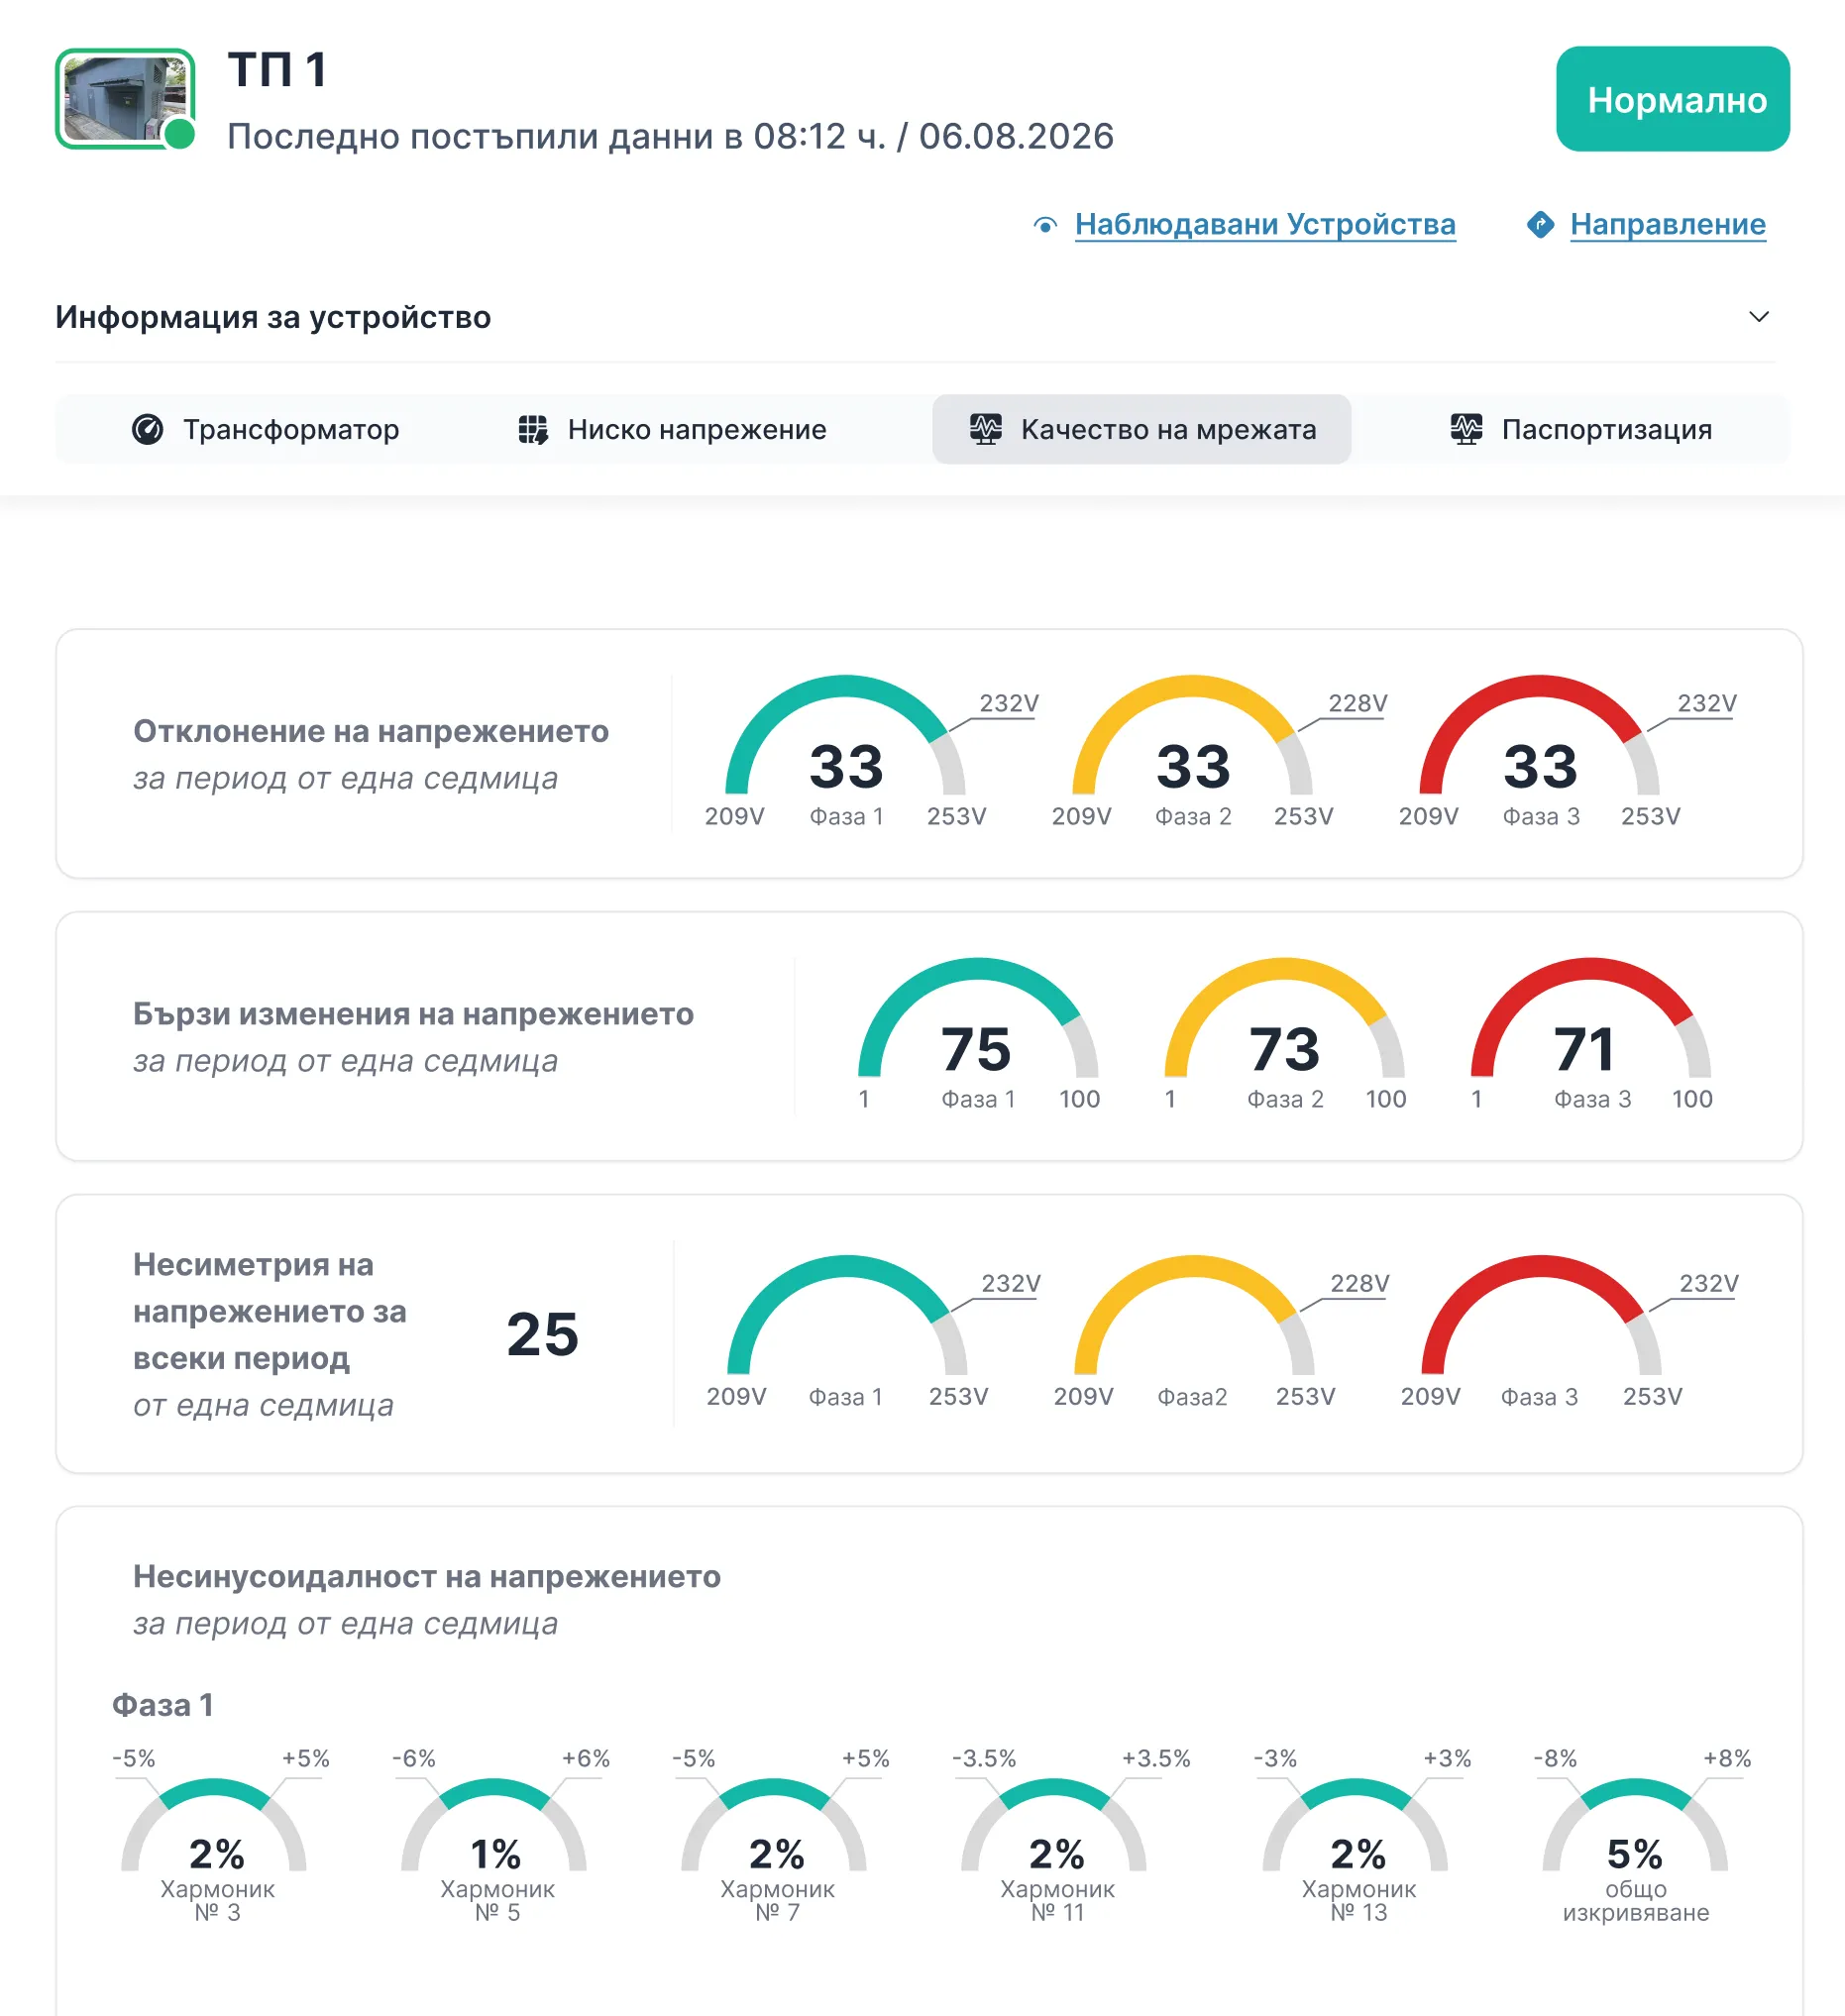
Power quality over a week

Voltage deviation, rapid voltage changes, asymmetry and harmonics from the 3rd to the 13th with the total distortion, per phase.

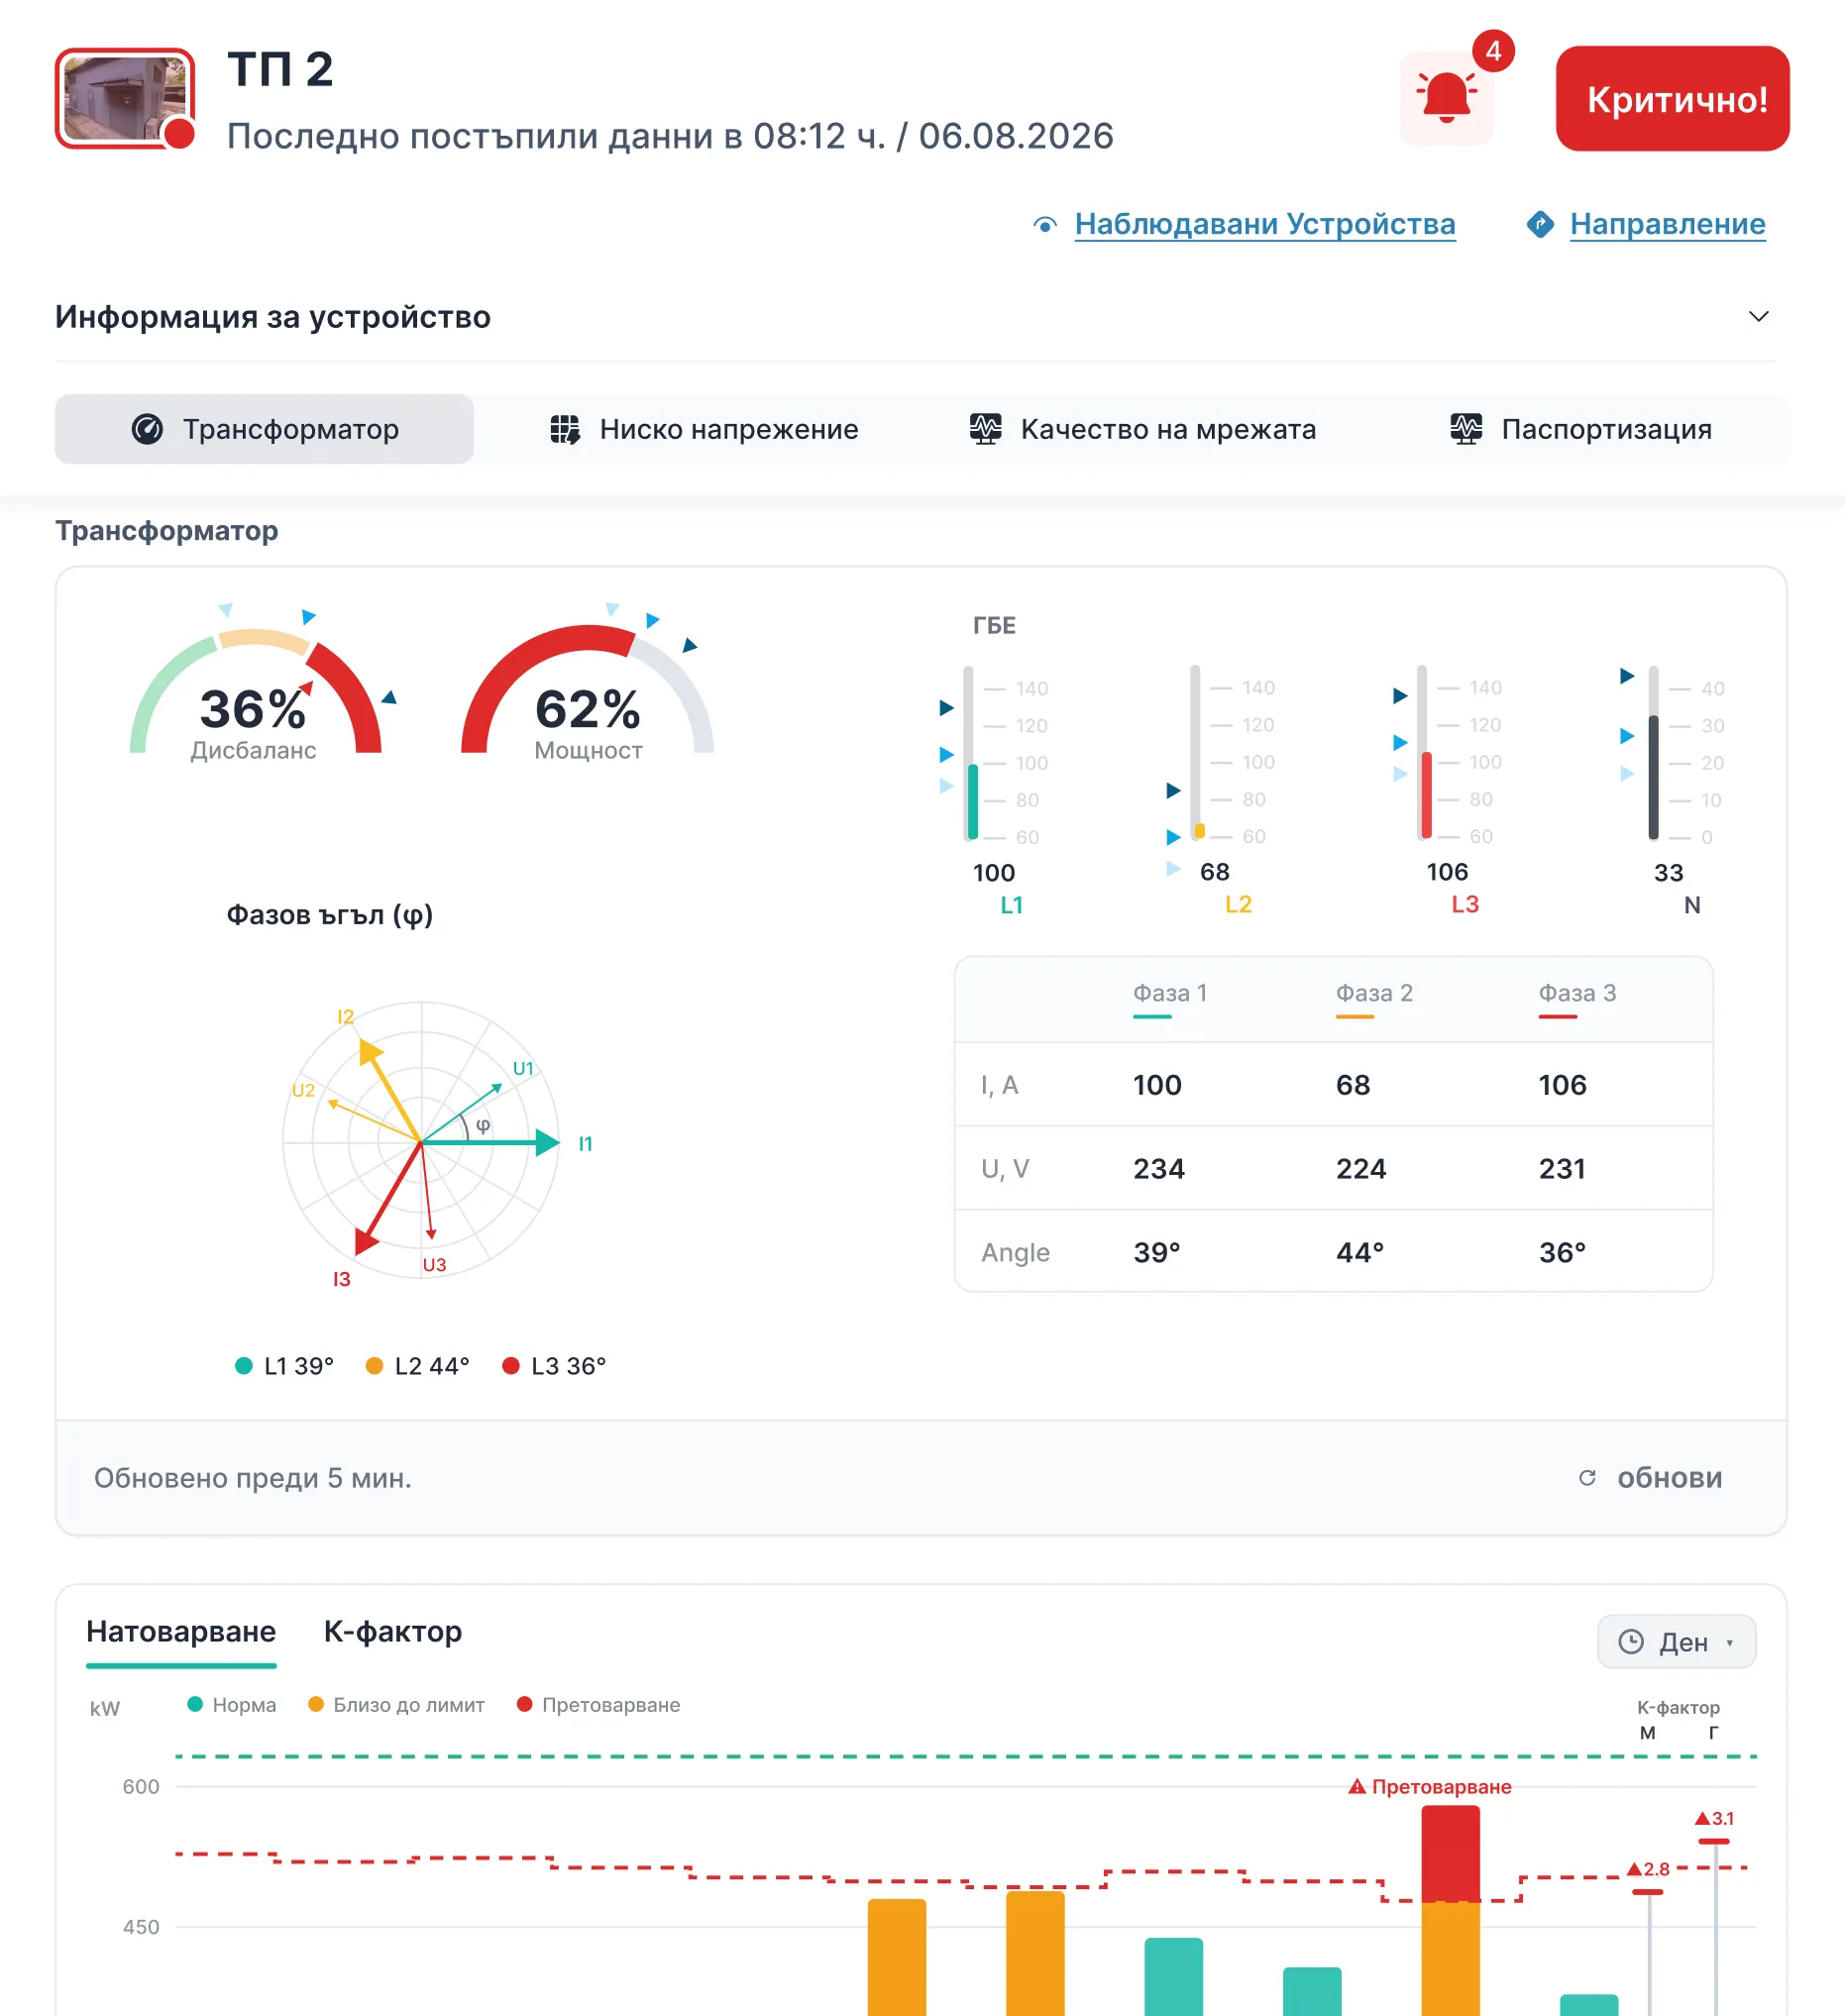
A substation that needs attention

The state turns critical, the bell counts the active alarms and the values outside their range turn red, here an imbalance of 36 % and an overloaded hour.

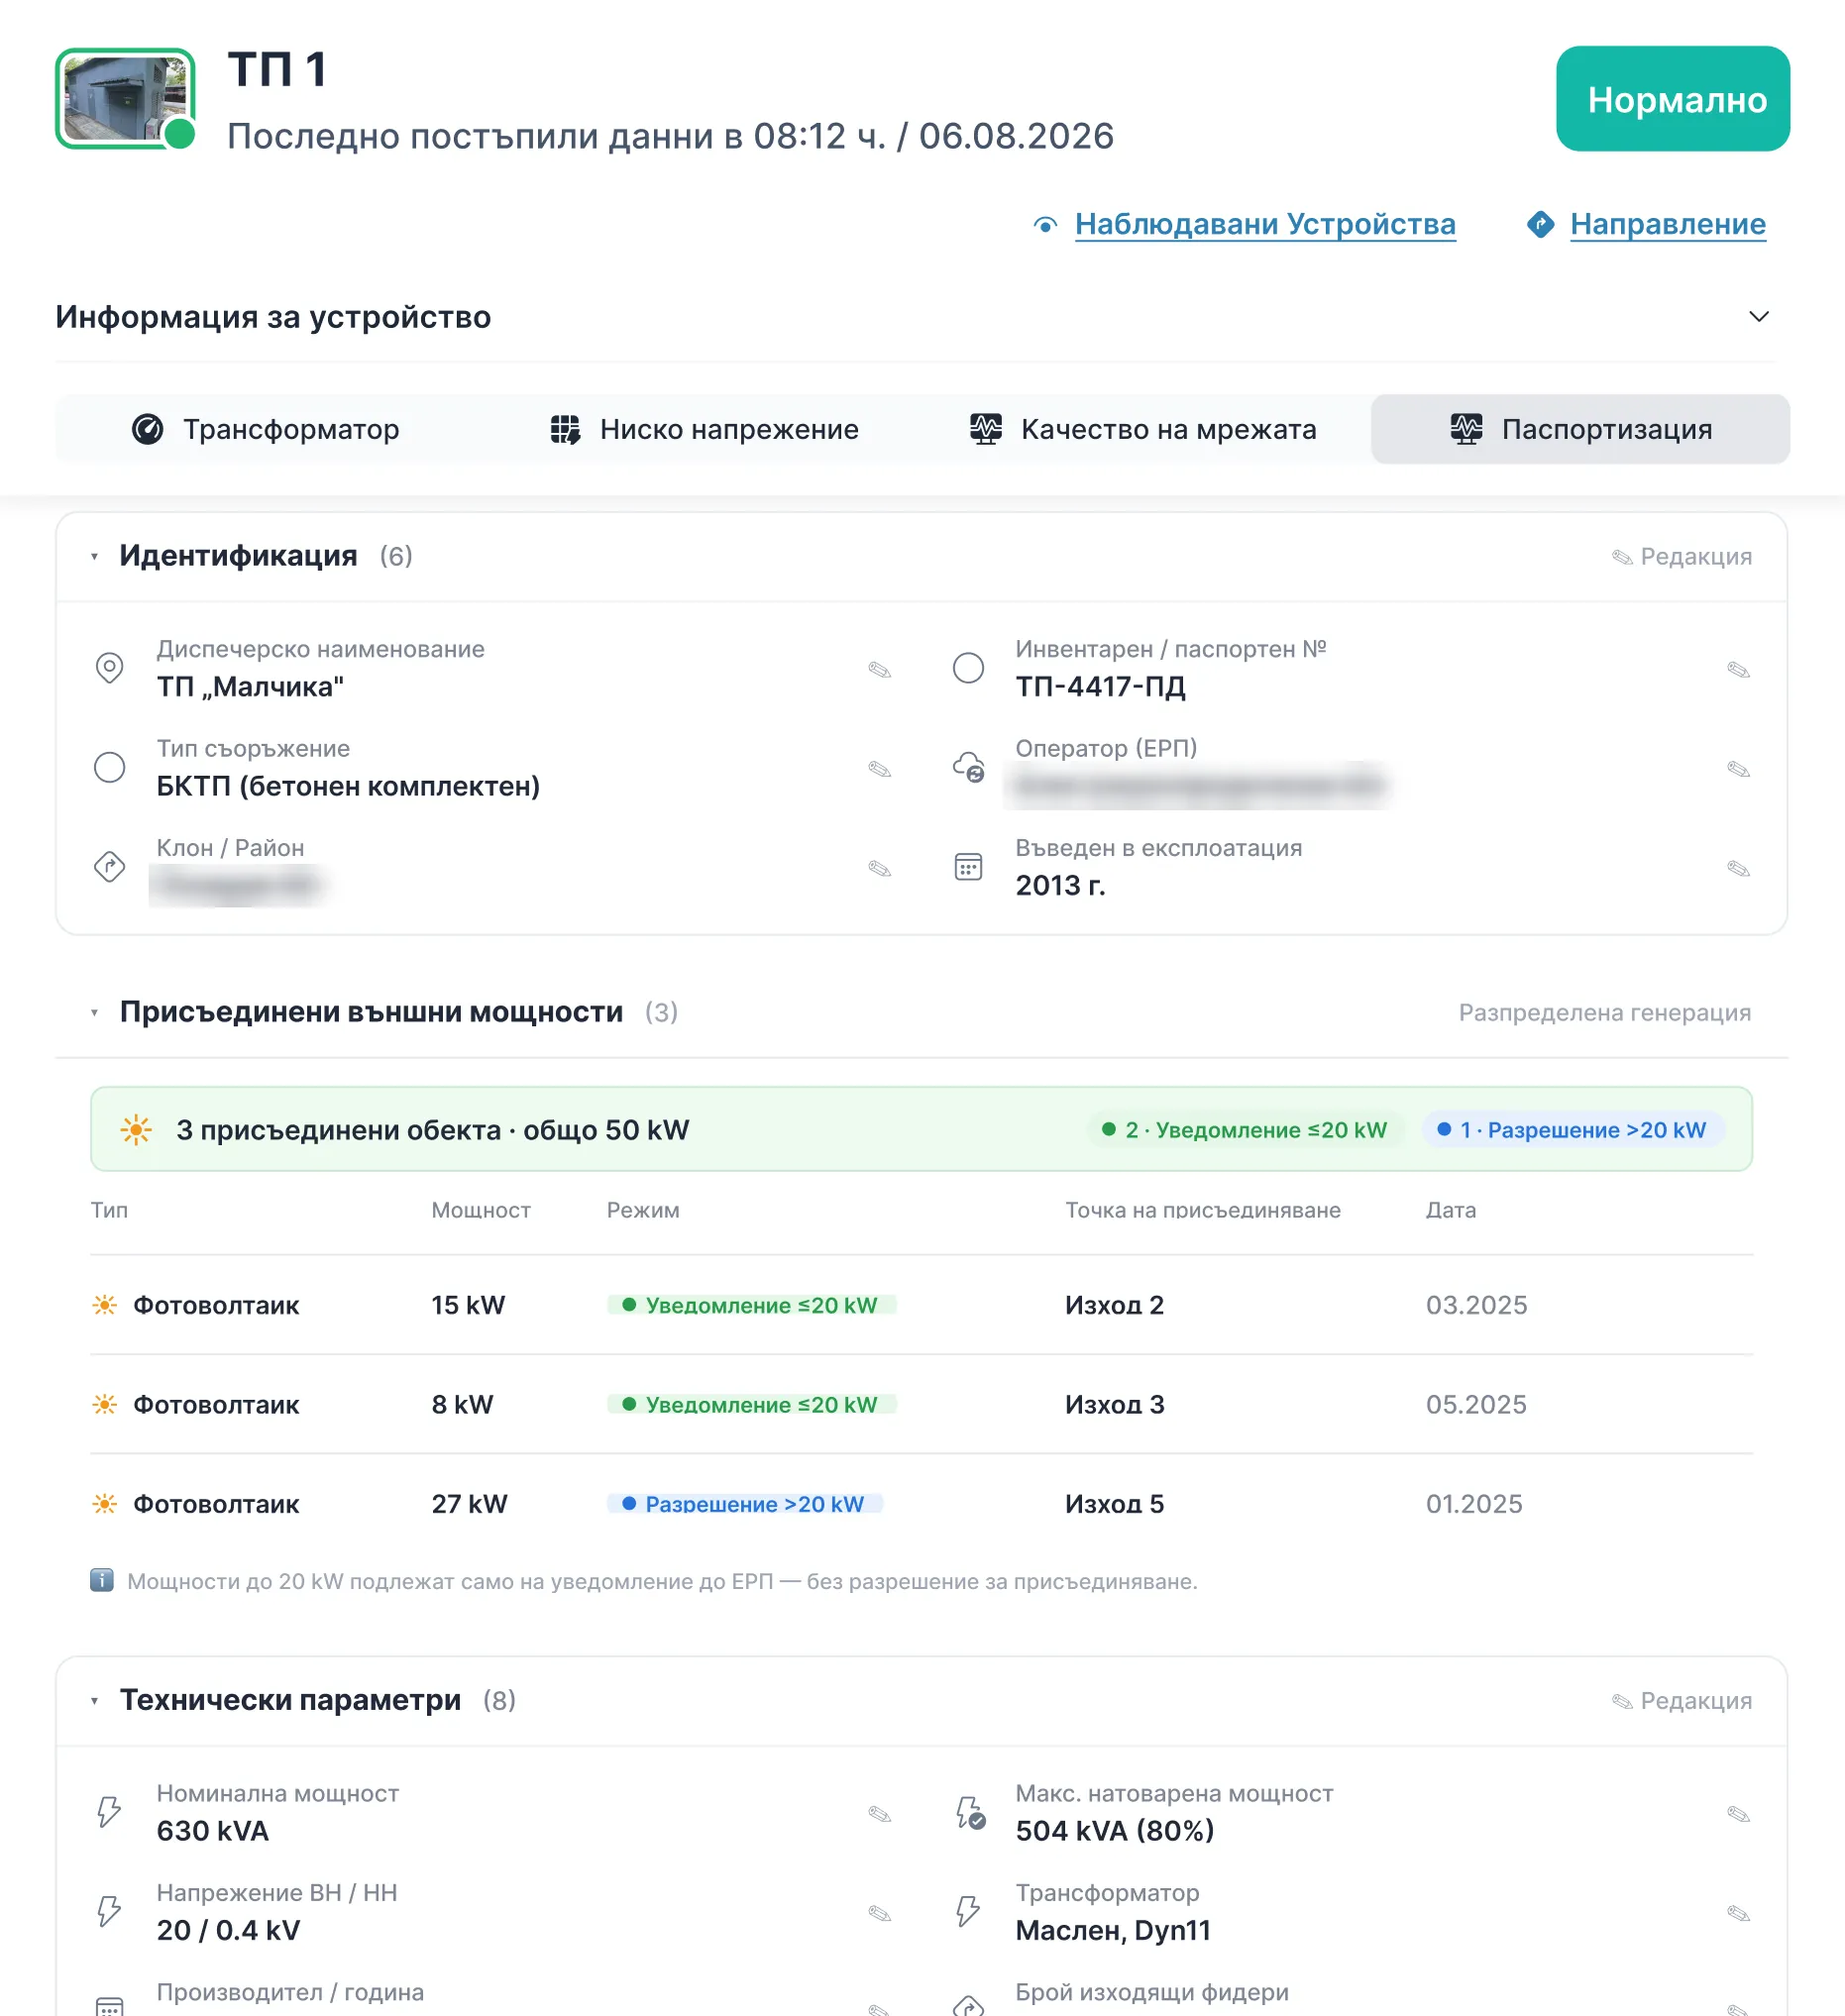
The passport of the asset

Identification, technical parameters of the transformer and the generation connected behind it: type, power, connection point and whether it came with a notification or a permit.

Keep scrolling

Screens from the interface design, with sample data.

The platform

One panel per substation

  1. The transformer at a glance

    The transformer at a glance

    Load and imbalance as gauges, current per phase and in the neutral against its limits, the phase angles as a vector diagram and a table of current, voltage and angle per phase.

  2. Load against the limit, hour by hour

    Load against the limit, hour by hour

    The chart marks the hours near the limit and the hours above it. A second tab shows the K-factor, the extra heating that harmonics cause.

  3. The busbar and every circuit

    The busbar and every circuit

    Current and voltage per phase with the minimum, average and maximum for the period, then the same for each outgoing circuit.

  4. Power quality over a week

    Power quality over a week

    Voltage deviation, rapid voltage changes, asymmetry and harmonics from the 3rd to the 13th with the total distortion, per phase.

  5. A substation that needs attention

    A substation that needs attention

    The state turns critical, the bell counts the active alarms and the values outside their range turn red, here an imbalance of 36 % and an overloaded hour.

  6. The passport of the asset

    The passport of the asset

    Identification, technical parameters of the transformer and the generation connected behind it: type, power, connection point and whether it came with a notification or a permit.

Screens from the interface design, with sample data.

Planning

See the overload coming

A transformer rarely fails without warning. The load creeps up over months as new consumers and plants connect. With the load of every hour against the limit, you know which transformer to resize first and which one still has room.

Limit of the transformer
  1. 00:00
  2. 04:00
  3. 08:00
  4. 12:00
  5. 16:00
  6. Overload
  7. 20:00
Load through the dayNormalNear the limitOverload

Illustration, not measured data.

Functions

What the platform does

01

Real-time monitoring

Problems are found and handled before they grow.

02

Notifications and alarms

In the platform, by e-mail, by SMS and other channels.

03

GIS

The whole infrastructure on a map, one click to a substation.

04

Analyses and reports

Large volumes of data turned into a basis for planning.

05

Automation

Processes, tasks, analyses and reports set to the needs of the client.

06

Integration

With systems of other vendors through standard protocols.

07

System configuration

Devices, users and thresholds managed from the interface.

08

Cloud

No servers to buy or maintain.

Benefits

What you get

Efficient operation

Faults and disruptions are detected at once, response is quick and downtime is short.

Proactive maintenance

Failures are predicted before they happen, which extends the life of the substation components.

Lower costs

Preventing a major failure saves the repair or the replacement. Fewer site visits lower the cost of maintenance.

Safety

Hazards are identified early, so crews act in time and the risk of accidents drops.

  • Network status in real time

    For system planning and investment decisions.

  • Regulatory compliance

    Continuous monitoring helps meet the requirements and avoid penalties.

  • Customer satisfaction

    Reliable supply and faster grid expansion.

  • Experience gap

    Digital data helps when experienced field staff retire.

Clients

The most useful and important function for our work is the monitoring of the electrical infrastructure. It gives information about the state of the equipment and the infrastructure and helps us optimise our maintenance costs and our response time.
Krastina CholakovaMember of the Board of Directors, Energy Effect JSCTranslated from Bulgarian.

Questions

Short answers

Another question? Ask an engineer

What is GridBit EIM?

GridBit EIM is a monitoring system for the electrical infrastructure at low voltage. It adds sensors, analysers and a gateway to a secondary substation, and the platform shows the state of the transformer and the low-voltage board in real time, with alarms and reports.

Do we have to replace equipment in the substation?

No. EIM is a retrofit and the primary equipment stays as it is. The compact modules and sensors go in without long outages.

What does EIM measure in a substation?

Three groups of values. At the transformer: the temperature of the hot spots, and pressure, temperature, oil level and gas from the integrated safety detector. At the low-voltage board: current, voltage, power and power quality per phase, plus the state of the outgoing feeders, fuses and protections. In the room: humidity, temperature, smoke, water and intrusion.

Which power quality values does the platform show?

Voltage deviation, rapid voltage changes, asymmetry and harmonics from the 3rd to the 13th with the total distortion, per phase. The load chart marks the hours near and above the limit of the transformer, and a second tab shows the K-factor.

How does the data reach the platform?

A GridBit GWU gateway collects the data from the modules and the sensors over Modbus and sends it over the mobile network or Wi-Fi. The link is MQTTS, encrypted and two-way, so commands reach the substation too. The platform is software as a service on Microsoft Azure and opens in a browser.

Why monitor the low-voltage grid?

Because 65 % of all grid assets are in the low-voltage network and the operator often learns about a fault there from the customers. Heat pumps, charging points and rooftop plants load lines and transformers that were sized for another time. Hourly load data shows which transformer to resize first.

Can EIM work with systems from other vendors?

Yes. The platform integrates with systems of other vendors through standard protocols, and third-party sensors with Modbus or a 0 to 10 V output connect to the same line as the GridBit modules.

Ask for an EIM proposal

Tell us how many substations you have and what you want to see in them. We answer with a configuration and a quote.